
|
|
|
 在 GitHub 上檢視原始碼 在 GitHub 上檢視原始碼
|
|
總覽
機器學習演算法通常需要大量的運算。因此,量化機器學習應用程式的效能至關重要,以確保您執行的是模型的最優化版本。使用 TensorFlow Profiler 分析 TensorFlow 程式碼的執行效能。
設定
from datetime import datetime
from packaging import version

import os
TensorFlow Profiler 需要最新版本的 TensorFlow 和 TensorBoard (>=2.2)。
pip install -U tensorboard_plugin_profile
import tensorflow as tf

print("TensorFlow version: ", tf.__version__)
TensorFlow version: 2.2.0-dev20200405
確認 TensorFlow 可以存取 GPU。
device_name = tf.test.gpu_device_name()
if not device_name:
  raise SystemError('GPU device not found')
print('Found GPU at: {}'.format(device_name))
Found GPU at: /device:GPU:0
使用 TensorBoard 回呼訓練圖片分類模型
在本教學課程中,您將探索 TensorFlow Profiler 的功能,方法是擷取訓練模型以分類 MNIST 資料集中圖片所取得的效能分析。
使用 TensorFlow 資料集匯入訓練資料,並將其分割成訓練集和測試集。
import tensorflow_datasets as tfds
tfds.disable_progress_bar()
(ds_train, ds_test), ds_info = tfds.load(
    'mnist',
    split=['train', 'test'],
    shuffle_files=True,
    as_supervised=True,
    with_info=True,
)
WARNING:absl:Dataset mnist is hosted on GCS. It will automatically be downloaded to your
local data directory. If you'd instead prefer to read directly from our public
GCS bucket (recommended if you're running on GCP), you can instead set
data_dir=gs://tfds-data/datasets.
Downloading and preparing dataset mnist/3.0.0 (download: 11.06 MiB, generated: Unknown size, total: 11.06 MiB) to /root/tensorflow_datasets/mnist/3.0.0...
Dataset mnist downloaded and prepared to /root/tensorflow_datasets/mnist/3.0.0. Subsequent calls will reuse this data.
藉由將像素值正規化為介於 0 和 1 之間,來預先處理訓練和測試資料。
def normalize_img(image, label):
  """Normalizes images: `uint8` -> `float32`."""
  return tf.cast(image, tf.float32) / 255., label

ds_train = ds_train.map(normalize_img)
ds_train = ds_train.batch(128)
ds_test = ds_test.map(normalize_img)
ds_test = ds_test.batch(128)
使用 Keras 建立圖片分類模型。
model = tf.keras.models.Sequential([
  tf.keras.layers.Flatten(input_shape=(28, 28, 1)),
  tf.keras.layers.Dense(128,activation='relu'),
  tf.keras.layers.Dense(10, activation='softmax')
])
model.compile(
    loss='sparse_categorical_crossentropy',
    optimizer=tf.keras.optimizers.Adam(0.001),
    metrics=['accuracy']
)
建立 TensorBoard 回呼以擷取效能分析,並在訓練模型時呼叫它。
# Create a TensorBoard callback
logs = "logs/" + datetime.now().strftime("%Y%m%d-%H%M%S")

tboard_callback = tf.keras.callbacks.TensorBoard(log_dir = logs,
                                                 histogram_freq = 1,
                                                 profile_batch = '500,520')

model.fit(ds_train,
          epochs=2,
          validation_data=ds_test,
          callbacks = [tboard_callback])
Epoch 1/2
469/469 [==============================] - 11s 22ms/step - loss: 0.3684 - accuracy: 0.8981 - val_loss: 0.1971 - val_accuracy: 0.9436
Epoch 2/2
 50/469 [==>...........................] - ETA: 9s - loss: 0.2014 - accuracy: 0.9439WARNING:tensorflow:From /usr/local/lib/python3.6/dist-packages/tensorflow/python/ops/summary_ops_v2.py:1271: stop (from tensorflow.python.eager.profiler) is deprecated and will be removed after 2020-07-01.
Instructions for updating:
use `tf.profiler.experimental.stop` instead.
WARNING:tensorflow:From /usr/local/lib/python3.6/dist-packages/tensorflow/python/ops/summary_ops_v2.py:1271: stop (from tensorflow.python.eager.profiler) is deprecated and will be removed after 2020-07-01.
Instructions for updating:
use `tf.profiler.experimental.stop` instead.
469/469 [==============================] - 11s 24ms/step - loss: 0.1685 - accuracy: 0.9525 - val_loss: 0.1376 - val_accuracy: 0.9595
<tensorflow.python.keras.callbacks.History at 0x7f23919a6a58>
使用 TensorFlow Profiler 分析模型訓練效能
TensorFlow Profiler 內嵌於 TensorBoard 中。使用 Colab magic 載入 TensorBoard 並啟動它。導覽至 [Profile] (分析) 標籤,即可檢視效能分析。
# Load the TensorBoard notebook extension.
%load_ext tensorboard
此模型的效能分析與下圖類似。
# Launch TensorBoard and navigate to the Profile tab to view performance profile
%tensorboard --logdir=logs
<IPython.core.display.Javascript object>
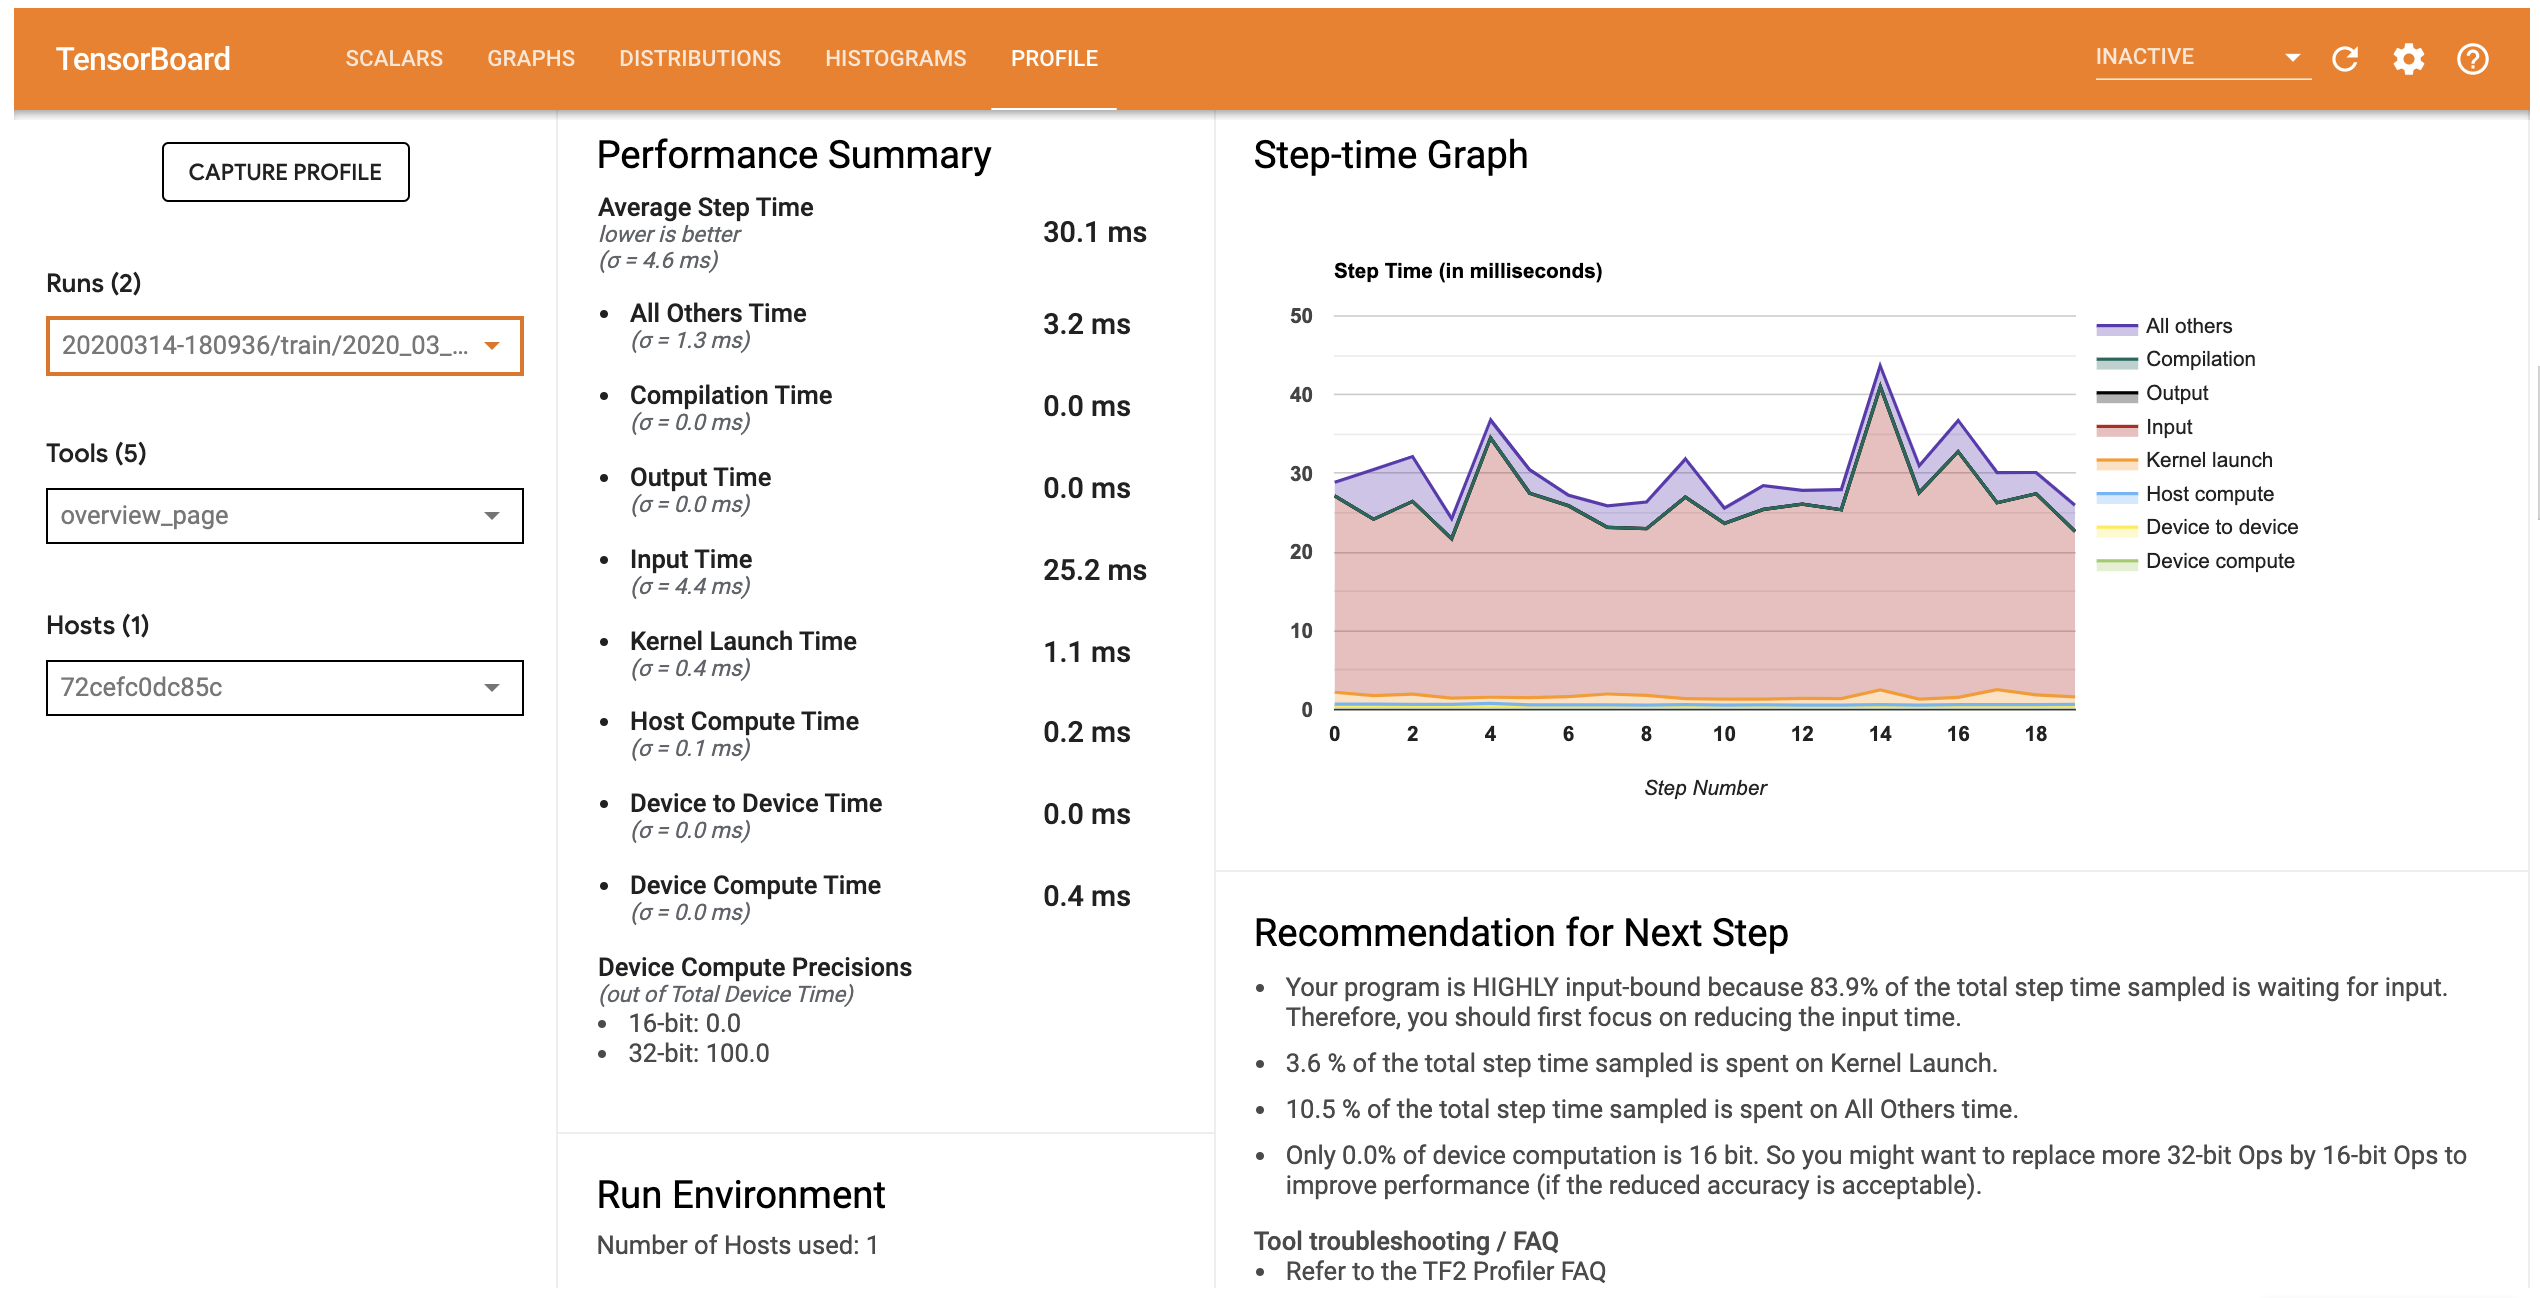
[Profile] (分析) 標籤會開啟 [Overview] (總覽) 頁面,其中會顯示模型效能的高階摘要。查看右側的 [Step-time Graph] (步驟時間圖表),您可以看到模型高度受輸入限制 (亦即,它在資料輸入管線中花費大量時間)。[Overview] (總覽) 頁面也會針對您可以遵循的潛在後續步驟,提供關於最佳化模型效能的建議。
若要瞭解輸入管線中效能瓶頸發生的位置,請從左側的 [Tools] (工具) 下拉式選單中選取 [Trace Viewer] (追蹤檢視器)。[Trace Viewer] (追蹤檢視器) 會顯示在分析期間 CPU 和 GPU 上發生的不同事件的時間軸。
[Trace Viewer] (追蹤檢視器) 會在垂直軸上顯示多個事件群組。每個事件群組都有多個水平軌跡,其中填滿了追蹤事件。軌跡是執行緒或 GPU 串流上執行的事件事件時間軸。個別事件是時間軸軌跡上的彩色矩形區塊。時間從左向右移動。使用鍵盤快速鍵 W (放大)、S (縮小)、A (向左捲動) 和 D (向右捲動) 來導覽追蹤事件。
單一矩形代表一個追蹤事件。選取浮動工具列中的滑鼠游標圖示 (或使用鍵盤快速鍵 1) 並按一下追蹤事件以進行分析。這會顯示關於事件的資訊,例如其開始時間和持續時間。
除了按一下之外,您也可以拖曳滑鼠來選取一組追蹤事件。這會提供您該區域中所有事件的清單,以及事件摘要。使用 M 鍵測量選取事件的時間長度。
追蹤事件是從下列項目收集而來
- CPU:CPU 事件顯示在名為
/host:CPU的事件群組下。每個軌跡代表 CPU 上的執行緒。CPU 事件包括輸入管線事件、GPU 運算 (op) 排程事件、CPU op 執行事件等等。 - GPU:GPU 事件顯示在字首為
/device:GPU:的事件群組下。每個事件群組代表 GPU 上的一個串流。
偵錯效能瓶頸
使用 [Trace Viewer] (追蹤檢視器) 找出輸入管線中的效能瓶頸。下圖是效能分析的快照。
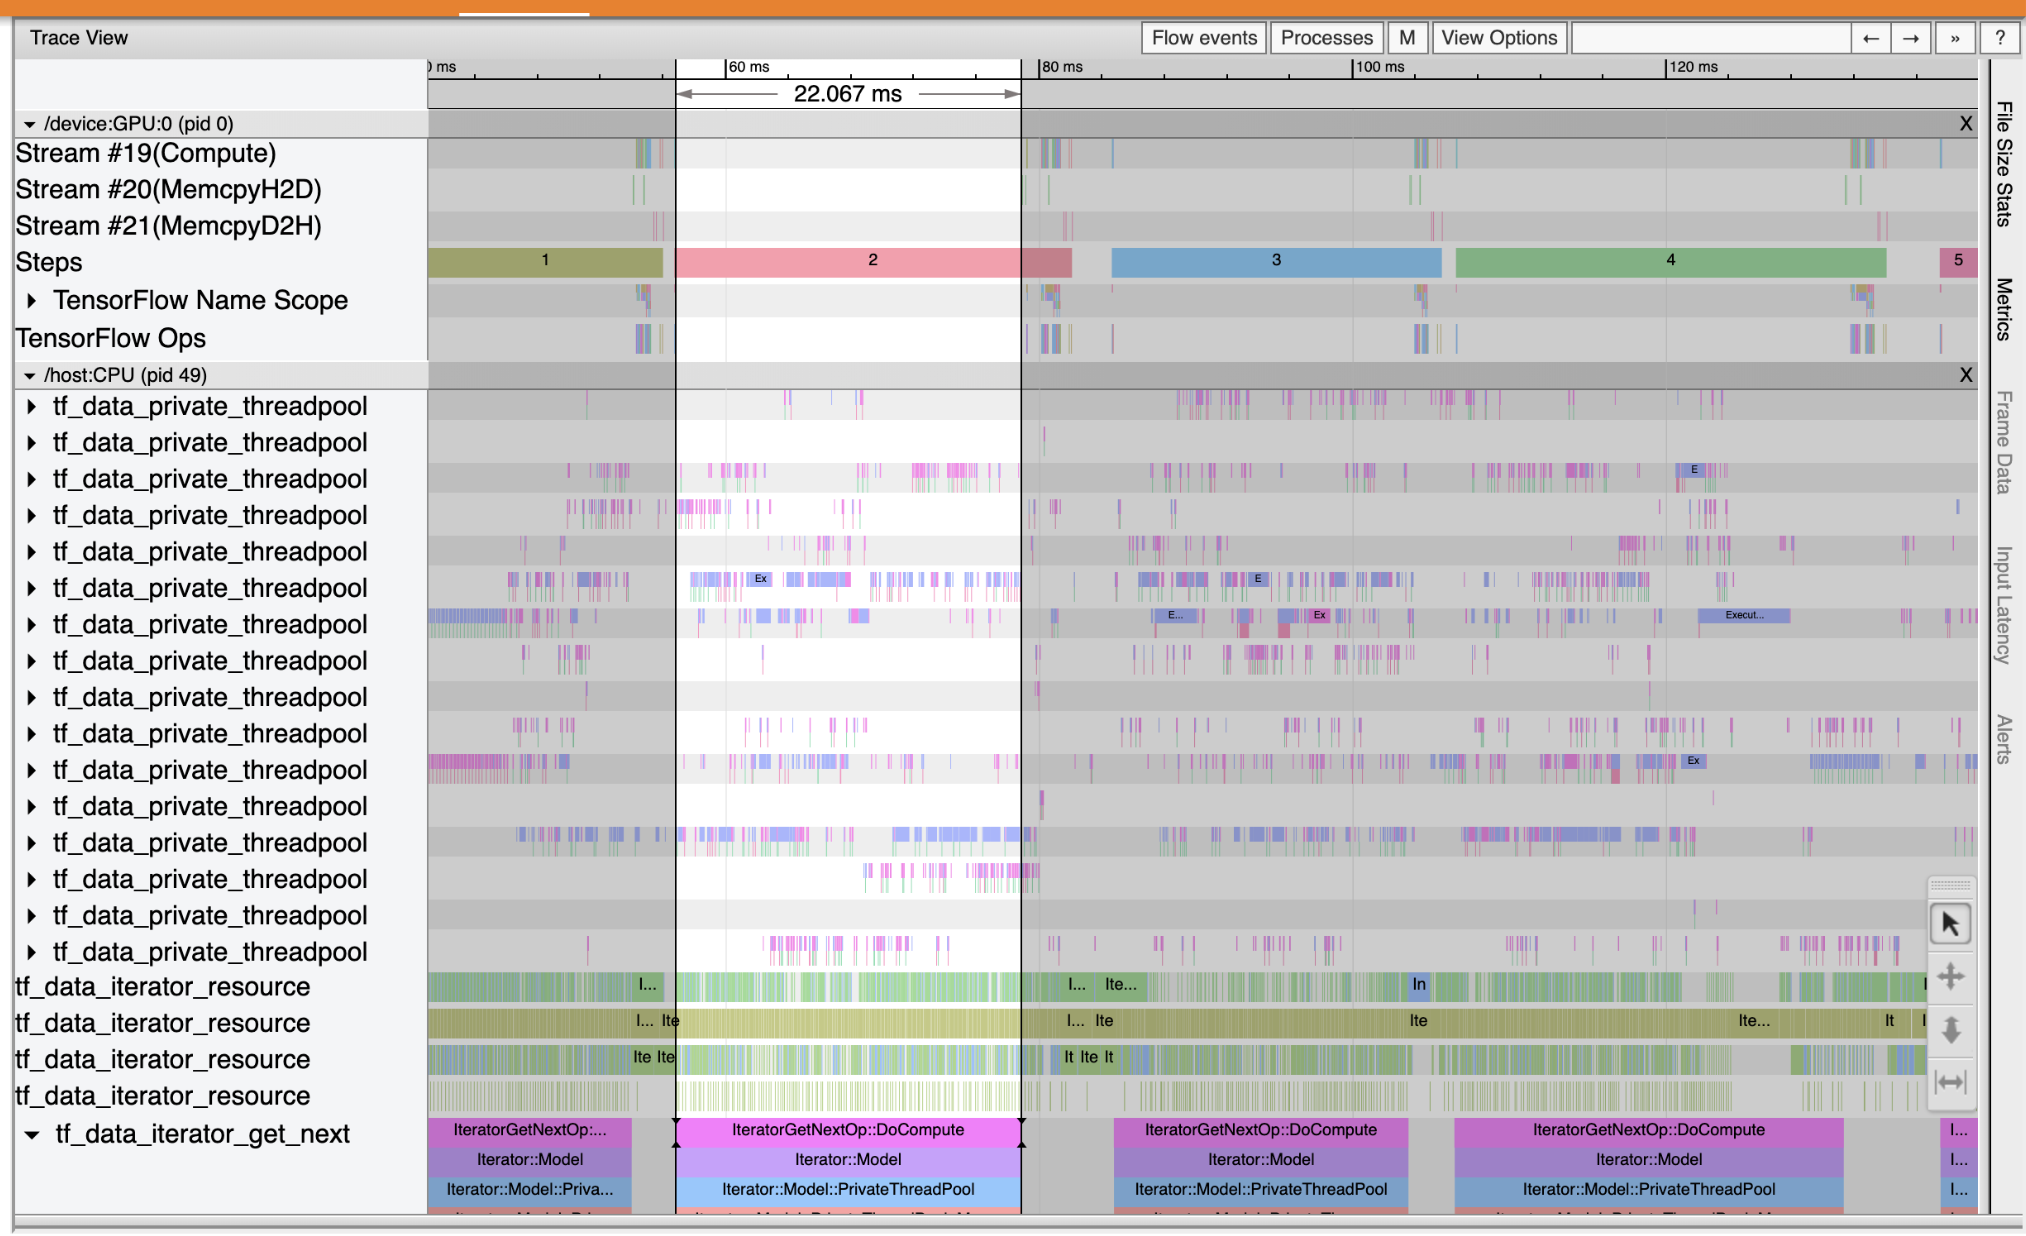
查看事件追蹤,您可以看到 GPU 在 tf_data_iterator_get_next op 在 CPU 上執行時處於非作用中狀態。此 op 負責處理輸入資料並將其傳送至 GPU 以進行訓練。作為一般經驗法則,最好始終保持裝置 (GPU/TPU) 處於作用中狀態。
使用 tf.data API 來最佳化輸入管線。在此案例中,讓我們快取訓練資料集並預先擷取資料,以確保 GPU 始終有資料可供處理。如需關於使用 tf.data 來最佳化輸入管線的更多詳細資訊,請參閱此處。
(ds_train, ds_test), ds_info = tfds.load(
    'mnist',
    split=['train', 'test'],
    shuffle_files=True,
    as_supervised=True,
    with_info=True,
)
ds_train = ds_train.map(normalize_img)
ds_train = ds_train.batch(128)
ds_train = ds_train.cache()
ds_train = ds_train.prefetch(tf.data.experimental.AUTOTUNE)
ds_test = ds_test.map(normalize_img)
ds_test = ds_test.batch(128)
ds_test = ds_test.cache()
ds_test = ds_test.prefetch(tf.data.experimental.AUTOTUNE)
再次訓練模型並重複使用先前的回呼,來擷取效能分析。
model.fit(ds_train,
          epochs=2,
          validation_data=ds_test,
          callbacks = [tboard_callback])
Epoch 1/2
469/469 [==============================] - 10s 22ms/step - loss: 0.1194 - accuracy: 0.9658 - val_loss: 0.1116 - val_accuracy: 0.9680
Epoch 2/2
469/469 [==============================] - 1s 3ms/step - loss: 0.0918 - accuracy: 0.9740 - val_loss: 0.0979 - val_accuracy: 0.9712
<tensorflow.python.keras.callbacks.History at 0x7f23908762b0>
重新啟動 TensorBoard 並開啟 [Profile] (分析) 標籤,以觀察更新後輸入管線的效能分析。
具有最佳化輸入管線之模型的效能分析與下圖類似。
%tensorboard --logdir=logs
Reusing TensorBoard on port 6006 (pid 750), started 0:00:12 ago. (Use '!kill 750' to kill it.)
<IPython.core.display.Javascript object>
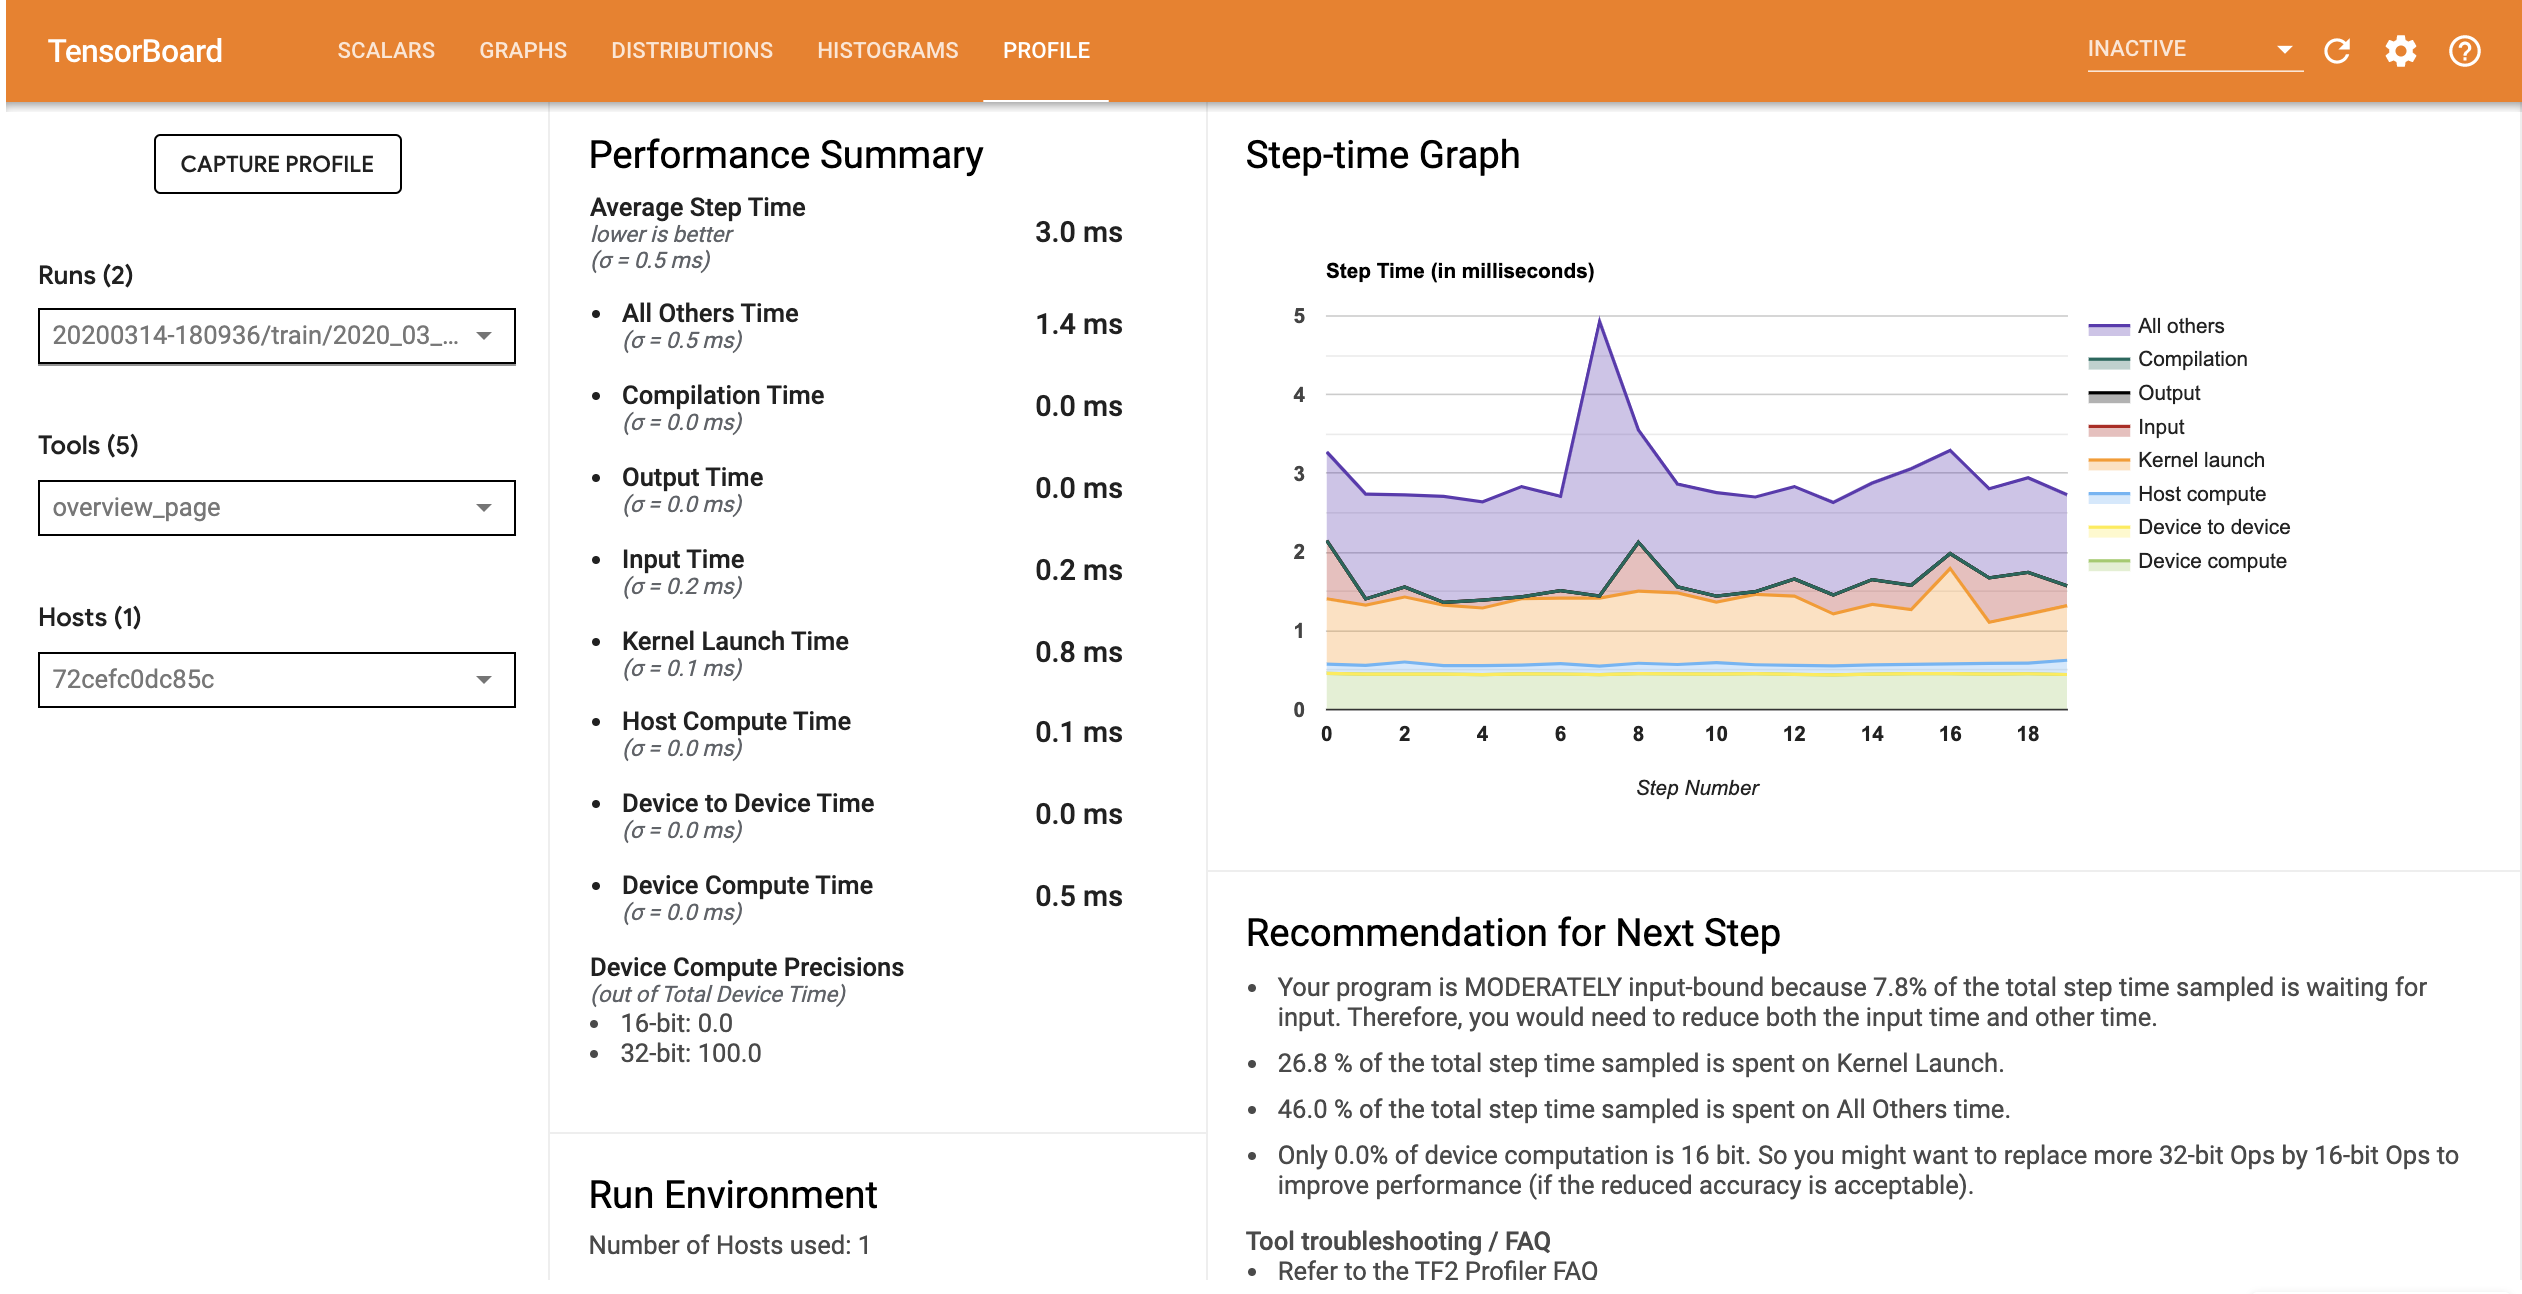
從 [Overview] (總覽) 頁面,您可以看到平均步驟時間已減少,輸入步驟時間也已減少。[Step-time Graph] (步驟時間圖表) 也指出模型不再高度受輸入限制。開啟 [Trace Viewer] (追蹤檢視器),以檢查具有最佳化輸入管線的追蹤事件。
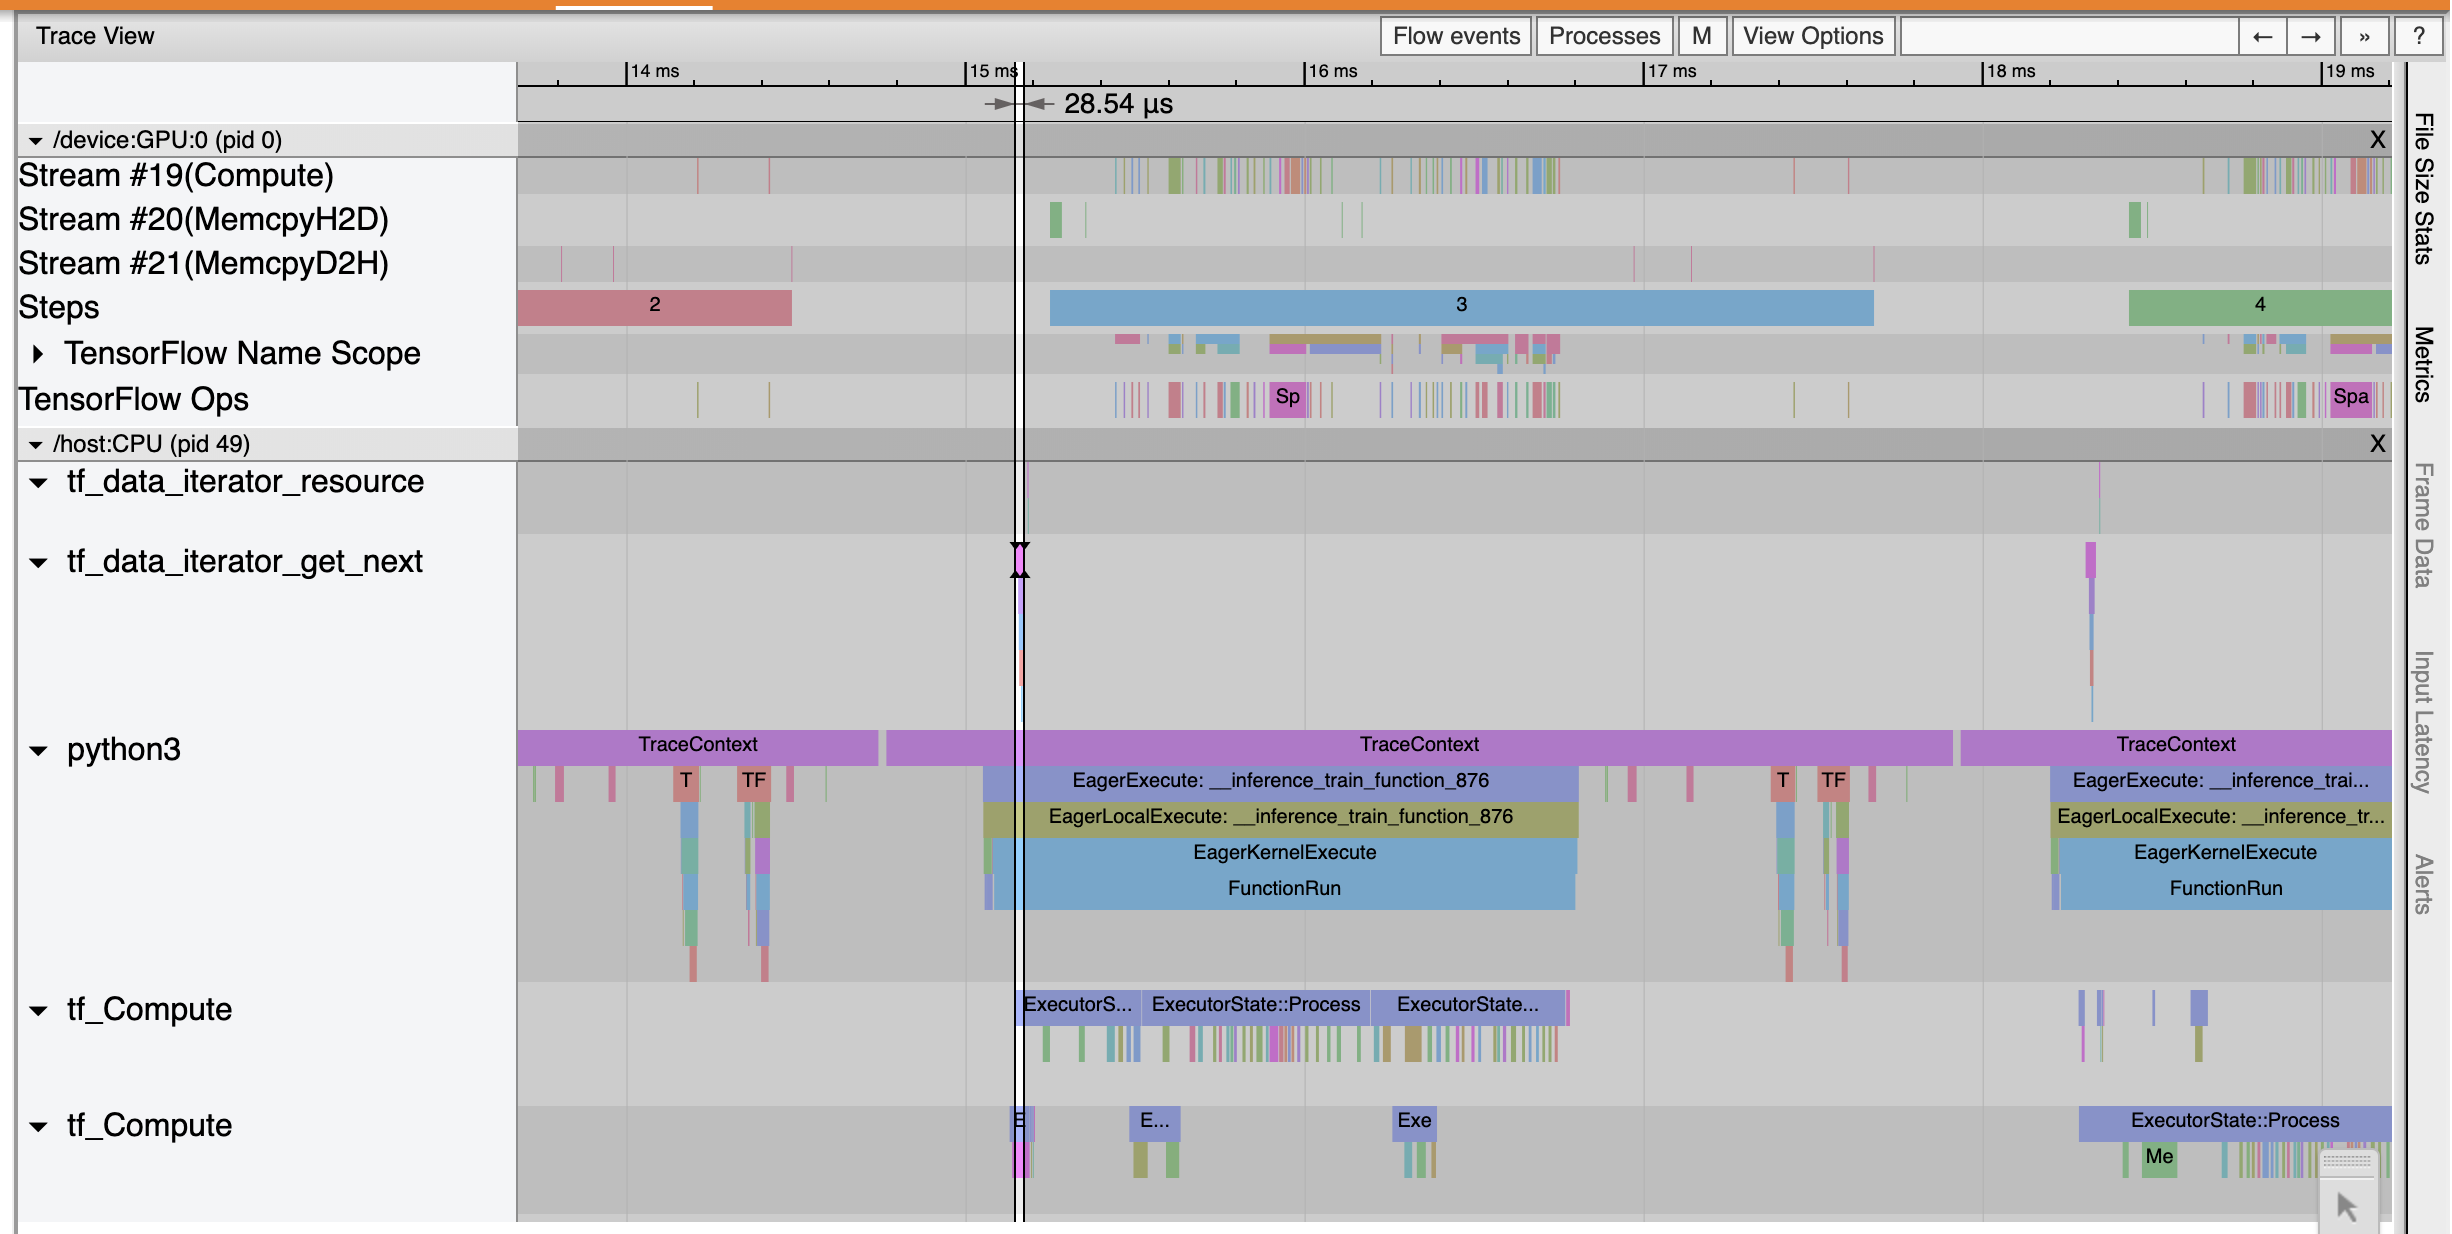
[Trace Viewer] (追蹤檢視器) 顯示 tf_data_iterator_get_next op 的執行速度快得多。因此,GPU 獲得穩定的資料串流以執行訓練,並透過模型訓練達成更好的利用率。
摘要
使用 TensorFlow Profiler 分析和偵錯模型訓練效能。閱讀 Profiler 指南並觀看 TensorFlow Dev Summit 2020 的 Performance profiling in TF 2 演講,以深入瞭解 TensorFlow Profiler。