
|
|
|
 在 GitHub 上檢視 在 GitHub 上檢視
|
|
簡介
初學者教學課程示範如何使用 TensorFlow 的決策樹森林準備資料、訓練及評估 (隨機森林、梯度提升樹狀結構和 CART) 分類器和迴歸器。(我們會將 TensorFlow 決策樹森林簡稱為 TF-DF。) 您也學到如何使用內建的 plot_model_in_colab() 函數將樹狀結構視覺化,以及顯示特徵重要性度量。
本教學課程的目標是透過視覺化深入探討分類器和迴歸器決策樹的解譯。我們將查看詳細的樹狀結構圖例,以及決策樹如何分割特徵空間以做出決策的描述。樹狀結構圖有助於我們瞭解模型的行為,而特徵空間圖則有助於我們透過呈現特徵與目標變數之間的關係來瞭解資料。
我們將使用的視覺化程式庫稱為 dtreeviz,為了保持一致性,我們將重複使用初學者教學課程中的企鵝和鮑魚資料。(若要進一步瞭解 dtreeviz 和決策樹的視覺化,請參閱 YouTube 影片或 dtreeviz 設計相關文章)。
在本教學課程中,您將學習如何
- 顯示來自 TF-DF 森林的決策樹結構
- 變更 dtreeviz 樹狀結構圖的大小和樣式
- 繪製葉節點資訊,例如每個葉節點的執行個體數量、每個葉節點中目標值的分布,以及關於葉節點的各種統計資料
- 追蹤樹狀結構針對特定執行個體的解譯,並顯示從根節點到做出預測的葉節點的路徑
- 印出樹狀結構如何解譯執行個體的英文解譯
- 檢視一維和二維特徵空間,以瞭解模型如何將其分割成相似執行個體的區域
設定
安裝 TF-DF 和 dtreeviz
pip install -q -U tensorflow_decision_forests
pip install -q -U dtreeviz
匯入程式庫
import tensorflow_decision_forests as tfdf

import tensorflow as tf

import os
import numpy as np
import pandas as pd
import tensorflow as tf
import math

import dtreeviz

from matplotlib import pyplot as plt
from IPython import display

# avoid "Arial font not found warnings"
import logging
logging.getLogger('matplotlib.font_manager').setLevel(level=logging.CRITICAL)

display.set_matplotlib_formats('retina') # generate hires plots

np.random.seed(1234)  # reproducible plots/data for explanatory reasons
/tmpfs/tmp/ipykernel_61816/31193553.py:20: DeprecationWarning: `set_matplotlib_formats` is deprecated since IPython 7.23, directly use `matplotlib_inline.backend_inline.set_matplotlib_formats()`
# Let's check the versions:
tfdf.__version__, dtreeviz.__version__  # want dtreeviz >= 2.2.0
('1.9.0', '2.2.2')
有一個將資料集分割為訓練集和測試集的函數會很方便,因此讓我們定義一個
def split_dataset(dataset, test_ratio=0.30, seed=1234):
  """
  Splits a panda dataframe in two, usually for train/test sets.
  Using the same random seed ensures we get the same split so
  that the description in this tutorial line up with generated images.
  """
  np.random.seed(seed)
  test_indices = np.random.rand(len(dataset)) < test_ratio
  return dataset[~test_indices], dataset[test_indices]
視覺化分類器樹狀結構
 使用企鵝資料,讓我們建構一個分類器,從其他 7 欄預測
 species (Adelie、Gentoo 或 Chinstrap)。然後,我們可以利用 dtreeviz 顯示樹狀結構並詢問模型,以進一步瞭解其如何做出決策,並進一步瞭解我們的資料。
載入、清理和準備資料
如同在初學者教學課程中所做,讓我們先下載企鵝資料並將其放入 pandas 資料框架。
# Download the Penguins dataset
!wget -q https://storage.googleapis.com/download.tensorflow.org/data/palmer_penguins/penguins.csv -O /tmp/penguins.csv

# Load a dataset into a Pandas Dataframe.
df_penguins = pd.read_csv("/tmp/penguins.csv")
df_penguins.head(3)
快速檢查顯示資料集中有遺失值
df_penguins.columns[df_penguins.isna().any()].tolist()
['bill_length_mm', 'bill_depth_mm', 'flipper_length_mm', 'body_mass_g', 'sex']
與其填補遺失值,不如直接捨棄不完整的列,以便在本教學課程中專注於視覺化
df_penguins = df_penguins.dropna() # E.g., 19 rows have missing sex etc...
TF-DF 需要分類標籤為 [0, num_labels) 中的整數,因此讓我們將標籤欄 species 從字串轉換為整數。
penguin_label = "species"   # Name of the classification target label
classes = list(df_penguins[penguin_label].unique())
df_penguins[penguin_label] = df_penguins[penguin_label].map(classes.index)

print(f"Target '{penguin_label}'' classes: {classes}")
df_penguins.head(3)
Target 'species'' classes: ['Adelie', 'Gentoo', 'Chinstrap']
現在,讓我們使用上面定義的便利函數取得 70-30 的分割比例以進行訓練和測試,然後將這些資料框架轉換為 tensorflow 資料集。
分割訓練/測試集並訓練模型
# Split into training and test sets
train_ds_pd, test_ds_pd = split_dataset(df_penguins)
print(f"{len(train_ds_pd)} examples in training, {len(test_ds_pd)} examples for testing.")

# Convert to tensorflow data sets
train_ds = tfdf.keras.pd_dataframe_to_tf_dataset(train_ds_pd, label=penguin_label)
test_ds = tfdf.keras.pd_dataframe_to_tf_dataset(test_ds_pd, label=penguin_label)
243 examples in training, 90 examples for testing.
訓練隨機森林分類器
# Train a Random Forest model
cmodel = tfdf.keras.RandomForestModel(verbose=0, random_seed=1234)
cmodel.fit(train_ds)
[INFO 24-04-20 11:36:03.3354 UTC kernel.cc:1233] Loading model from path /tmpfs/tmp/tmp_53_u4ze/model/ with prefix becfdeef7e31483f
[INFO 24-04-20 11:36:03.3489 UTC decision_forest.cc:734] Model loaded with 300 root(s), 4310 node(s), and 7 input feature(s).
[INFO 24-04-20 11:36:03.3489 UTC abstract_model.cc:1344] Engine "RandomForestGeneric" built
[INFO 24-04-20 11:36:03.3490 UTC kernel.cc:1061] Use fast generic engine
<tf_keras.src.callbacks.History at 0x7fca787a2e80>
為了驗證一切正常運作,讓我們檢查模型的準確度,應約為 99%
cmodel.compile(metrics=["accuracy"])
cmodel.evaluate(test_ds, return_dict=True, verbose=0)
{'loss': 0.0, 'accuracy': 0.9888888597488403}
是的,模型在測試集上的準確度很高。
顯示決策樹
現在我們有了模型,讓我們從隨機森林中挑選一個樹狀結構,並查看其結構。dtreeviz 程式庫要求我們將 TF-DF 模型與相關的訓練資料捆綁在一起,然後它可以使用這些資料重複詢問模型。
# Tell dtreeviz about training data and model
penguin_features = [f.name for f in cmodel.make_inspector().features()]
viz_cmodel = dtreeviz.model(cmodel,
                           tree_index=3,
                           X_train=train_ds_pd[penguin_features],
                           y_train=train_ds_pd[penguin_label],
                           feature_names=penguin_features,
                           target_name=penguin_label,
                           class_names=classes)
最常見的 dtreeviz API 函數是 view(),它會顯示樹狀結構,以及與每個決策節點相關聯的執行個體的特徵分布。
viz_cmodel.view(scale=1.2)

決策樹的根節點表示分類從測試 flipper_length_mm 特徵開始,分割值為 206。如果測試執行個體的 flipper_length_mm 特徵值小於 206,則決策樹會下降到左子節點。如果大於或等於 206,則分類會繼續下降到右子節點。
若要瞭解模型為何選擇在 flipper_length_mm=206 處分割訓練資料,讓我們放大根節點
viz_cmodel.view(depth_range_to_display=[0,0], scale=1.5)

人類的眼睛可以清楚看到,206 右側幾乎所有執行個體都是藍色 (巴布亞企鵝 Gentoo)。因此,透過單一特徵比較,模型可以將訓練資料分割成相當純粹的巴布亞企鵝群組和混合群組。(模型將透過根節點下方的未來分割進一步純化子群組。)
決策樹也有一個類別決策節點,可以測試類別子集,而不是簡單的數值分割。例如,讓我們看看樹狀結構的第二層
viz_cmodel.view(depth_range_to_display=[1,1], scale=1.5)

節點 (在左側) 測試特徵 island,如果測試執行個體的 island==Dream,則分類會下降到其右子節點。對於其他兩個類別 Torgersen 和 Biscoe,分類會下降到其左子節點。(此圖中右側的 bill_length_mm 節點與此處關於類別決策節點的討論無關。)
這種分割行為突顯了決策樹將特徵空間分割成區域,目的是提高目標值的純度。我們將在下方更詳細地查看特徵空間。
決策樹可能會變得非常大,完整繪製它們並不一定有用。但是,我們可以查看樹狀結構的較簡單版本、樹狀結構的部分、各種葉節點 (在其中進行預測) 中訓練執行個體的數量等等... 以下範例說明如何關閉精美的決策節點分布圖例,並將整個影像縮小到 75%
viz_cmodel.view(fancy=False, scale=.75)

我們也可以使用從左到右的方向,有時可以產生較小的圖表
viz_cmodel.view(orientation='LR', scale=.75)

如果您不太喜歡圓餅圖,也可以取得長條圖。
viz_cmodel.view(leaftype='barh', scale=.75)

檢查葉節點統計資料
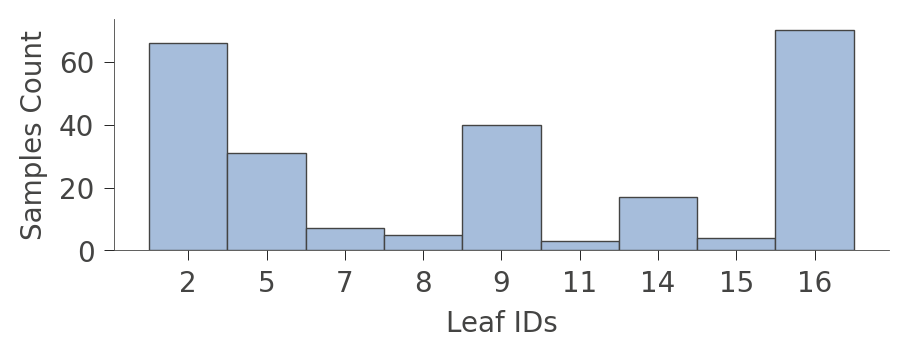
決策樹會在葉節點做出決策,因此有時放大這些節點會很有用,特別是當整個圖形太大而無法一次全部看到時。以下說明如何檢查分組到每個葉節點中的訓練資料執行個體數量
viz_cmodel.leaf_sizes(figsize=(5,1.5))
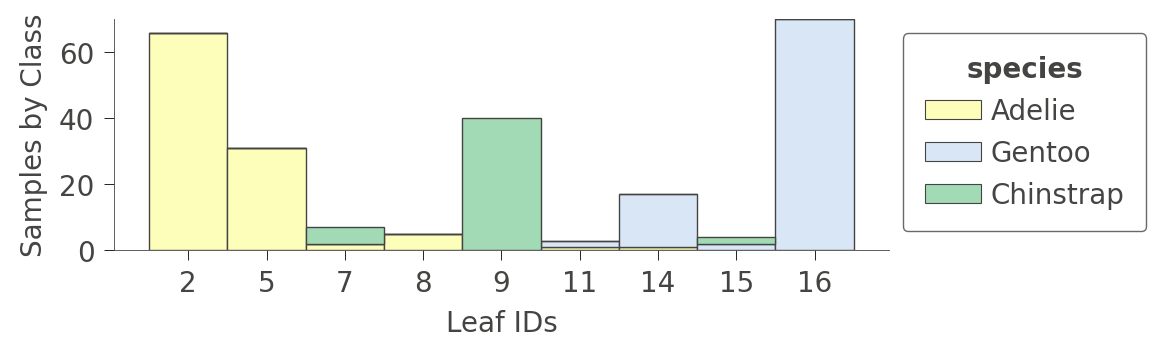
可能更有趣的圖形是顯示各種葉節點中每種訓練執行個體比例的圖形。訓練的目標是讓葉節點具有單一顏色,因為它代表「純粹」節點,可以高信賴度預測該類別。
viz_cmodel.ctree_leaf_distributions(figsize=(5,1.5))
我們也可以放大特定的葉節點,以查看各種執行個體特徵的一些統計資料。例如,葉節點 5 包含 31 個執行個體,其中 24 個具有唯一的 bill_length_mm 值
viz_cmodel.node_stats(node_id=5)
決策樹如何分類執行個體
現在我們已查看決策樹的結構和內容,讓我們瞭解分類器如何針對特定執行個體做出決策。透過將執行個體 (特徵向量) 作為引數 x 傳入,view() 函數會醒目提示分類器為了對該執行個體進行預測而遵循的從根節點到葉節點的路徑
x = train_ds_pd[penguin_features].iloc[20]
viz_cmodel.view(x=x, scale=.75)
/tmpfs/src/tf_docs_env/lib/python3.9/site-packages/dtreeviz/models/shadow_decision_tree.py:335: FutureWarning: Series.__getitem__ treating keys as positions is deprecated. In a future version, integer keys will always be treated as labels (consistent with DataFrame behavior). To access a value by position, use `ser.iloc[pos]`
/tmpfs/src/tf_docs_env/lib/python3.9/site-packages/dtreeviz/trees.py:1231: FutureWarning: Series.__getitem__ treating keys as positions is deprecated. In a future version, integer keys will always be treated as labels (consistent with DataFrame behavior). To access a value by position, use `ser.iloc[pos]`
/tmpfs/src/tf_docs_env/lib/python3.9/site-packages/dtreeviz/trees.py:1225: FutureWarning: Series.__getitem__ treating keys as positions is deprecated. In a future version, integer keys will always be treated as labels (consistent with DataFrame behavior). To access a value by position, use `ser.iloc[pos]`
/tmpfs/src/tf_docs_env/lib/python3.9/site-packages/dtreeviz/models/shadow_decision_tree.py:335: FutureWarning: Series.__getitem__ treating keys as positions is deprecated. In a future version, integer keys will always be treated as labels (consistent with DataFrame behavior). To access a value by position, use `ser.iloc[pos]`

圖例醒目提示樹狀結構路徑和已測試的執行個體特徵 (island、bill_length_mm 和 flipper_length_mm)。
對於非常大的樹狀結構,您也可以要求僅查看通過樹狀結構的路徑,而不查看整個樹狀結構,方法是使用 show_just_path 參數
viz_cmodel.view(x=x, show_just_path=True, scale=.75)
/tmpfs/src/tf_docs_env/lib/python3.9/site-packages/dtreeviz/models/shadow_decision_tree.py:335: FutureWarning: Series.__getitem__ treating keys as positions is deprecated. In a future version, integer keys will always be treated as labels (consistent with DataFrame behavior). To access a value by position, use `ser.iloc[pos]`
/tmpfs/src/tf_docs_env/lib/python3.9/site-packages/dtreeviz/trees.py:1231: FutureWarning: Series.__getitem__ treating keys as positions is deprecated. In a future version, integer keys will always be treated as labels (consistent with DataFrame behavior). To access a value by position, use `ser.iloc[pos]`
/tmpfs/src/tf_docs_env/lib/python3.9/site-packages/dtreeviz/trees.py:1225: FutureWarning: Series.__getitem__ treating keys as positions is deprecated. In a future version, integer keys will always be treated as labels (consistent with DataFrame behavior). To access a value by position, use `ser.iloc[pos]`
/tmpfs/src/tf_docs_env/lib/python3.9/site-packages/dtreeviz/models/shadow_decision_tree.py:335: FutureWarning: Series.__getitem__ treating keys as positions is deprecated. In a future version, integer keys will always be treated as labels (consistent with DataFrame behavior). To access a value by position, use `ser.iloc[pos]`

若要取得執行個體分類的英文解譯 (最小的可能表示法),請使用 explain_prediction_path()
print(viz_cmodel.explain_prediction_path(x=x))
bill_length_mm < 40.6
flipper_length_mm < 206.0
island in {'Dream'}
/tmpfs/src/tf_docs_env/lib/python3.9/site-packages/dtreeviz/models/shadow_decision_tree.py:335: FutureWarning: Series.__getitem__ treating keys as positions is deprecated. In a future version, integer keys will always be treated as labels (consistent with DataFrame behavior). To access a value by position, use `ser.iloc[pos]`
/tmpfs/src/tf_docs_env/lib/python3.9/site-packages/dtreeviz/interpretation.py:54: FutureWarning: Series.__getitem__ treating keys as positions is deprecated. In a future version, integer keys will always be treated as labels (consistent with DataFrame behavior). To access a value by position, use `ser.iloc[pos]`
模型會測試 x 的 bill_length_mm、flipper_length_mm 和 island 特徵以到達葉節點,在此範例中,葉節點預測 Adelie。
特徵空間分割
到目前為止,我們已查看樹狀結構的結構以及樹狀結構如何解譯執行個體以做出決策,但決策節點究竟在做什麼?決策樹將特徵空間分割成目標值相似的觀察值群組。每個葉節點代表從根節點到該葉節點所執行的特徵分割序列所產生的分割。對於分類,目標是讓分割共用相同或大致相同的目標類別值。
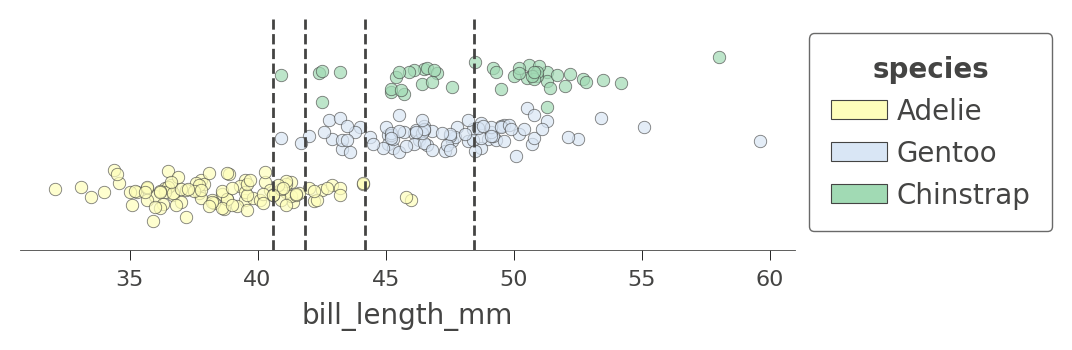
如果我們回顧樹狀結構,我們會看到變數 flipper_length_mm 由樹狀結構中的三個節點測試。對應的決策節點分割值為 189、206 和 210.5,這表示決策樹將 flipper_length_mm 分割成四個區域,我們可以使用 ctree_feature_space() 來圖解說明
viz_cmodel.ctree_feature_space(features=['flipper_length_mm'], show={'splits','legend'}, figsize=(5,1.5))

(垂直軸在此單一特徵案例中沒有意義。為了提高可見性,垂直軸僅將代表不同目標類別的點分成不同的高度,並加入一些雜訊。)
在 206 (在根節點測試) 的第一次分割將訓練資料分割成阿德利/巴布亞企鵝的重疊區域和相當純粹的帽帶企鵝區域。隨後在 210.5 的分割進一步隔離了純粹的帽帶企鵝區域 (鰭肢長度高於 210.5)。決策樹也在 189 處分割,但產生的區域仍然不純粹。樹狀結構依賴其他變數的分割來分隔 Adelie/Gentoo 企鵝的「混淆」叢集。因為我們已傳入單一特徵名稱,因此不會顯示其他特徵的分割。
讓我們看看另一個具有更多分割的特徵 bill_length_mm。決策樹中有四個節點測試該特徵,因此我們取得分割成五個區域的特徵空間。請注意模型如何透過測試 bill_length_mm 小於 40 來分割出一個純粹的 Adelie 區域
viz_cmodel.ctree_feature_space(features=['bill_length_mm'], show={'splits','legend'},
                               figsize=(5,1.5))
我們也可以檢查樹狀結構如何同時分割兩個特徵的特徵空間,例如 flipper_length_mm 和 bill_length_mm
viz_cmodel.ctree_feature_space(features=['flipper_length_mm','bill_length_mm'],
                               show={'splits','legend'}, figsize=(5,5))
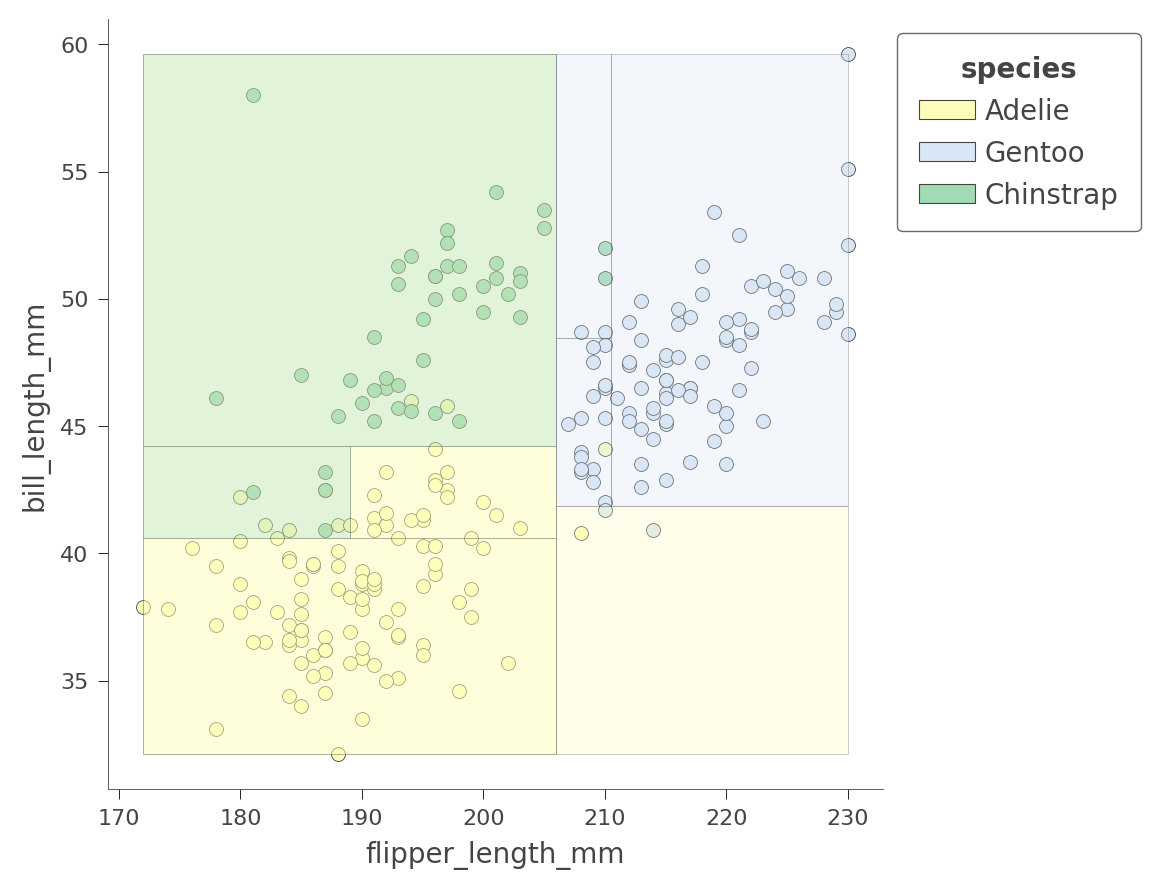
區域的顏色表示測試執行個體的分類顏色,其特徵落在該區域中。
透過同時考量兩個變數,決策樹可以建立更純粹 (矩形) 的區域,從而產生更準確的預測。例如,左上角區域完全封裝了帽帶企鵝 Chinstrap。
根據我們選擇的變數,區域的純度會有所不同。以下是特徵 bill_depth_mm 和 bill_length_mm 的另一個 2D 特徵空間分割,其中陰影表示不確定性。
viz_cmodel.ctree_feature_space(features=['body_mass_g','bill_length_mm'],
                               show={'splits','legend'}, figsize=(5,5))
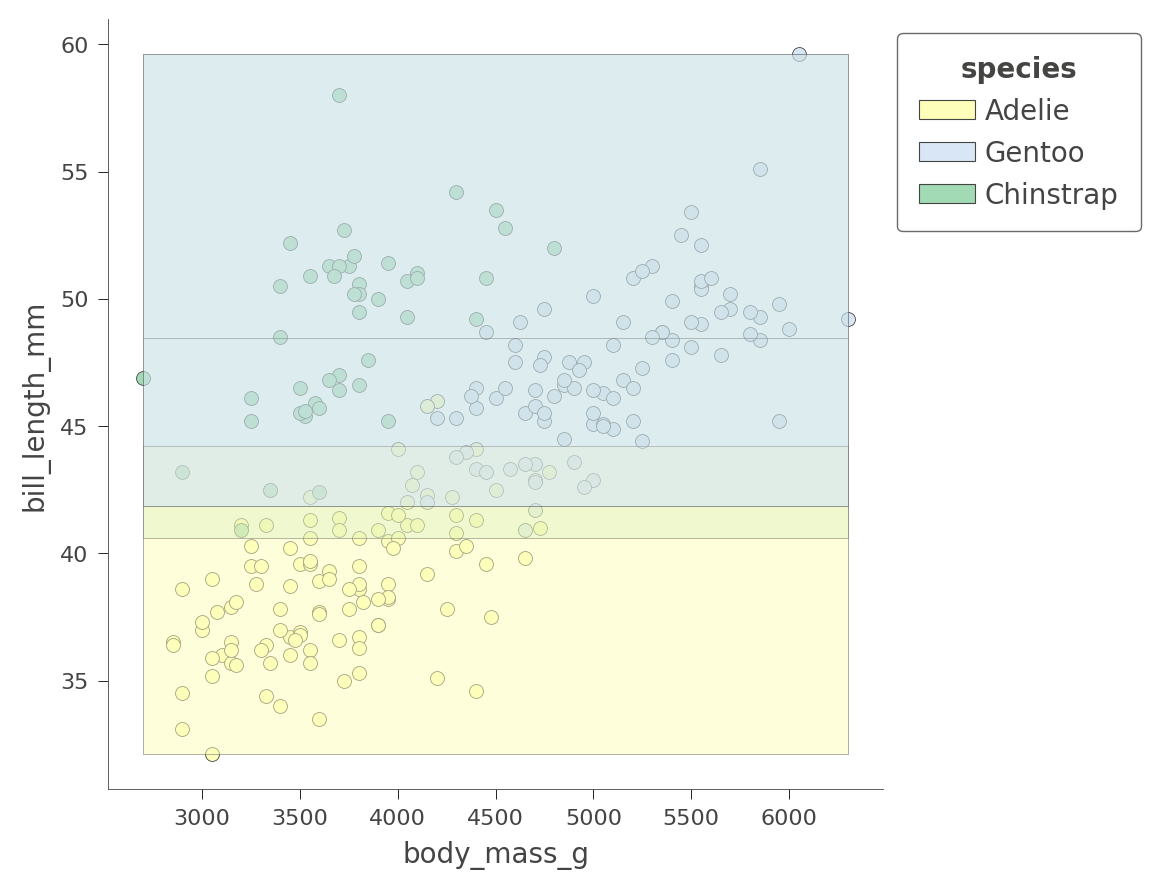
只有 Adelie 區域相當純粹。正如我們剛才在 flipper_length_mm 與 bill_length_mm 空間中看到的那樣,樹狀結構依賴其他變數來獲得更好的分割。
dtreeviz 程式庫目前無法視覺化超過兩個特徵維度的分類。
此時,您已充分掌握如何視覺化決策樹的結構、樹狀結構如何分割特徵空間,以及樹狀結構如何分類測試執行個體。現在讓我們轉向迴歸,看看 dtreeviz 如何視覺化迴歸樹狀結構。
視覺化迴歸器樹狀結構
 讓我們使用初學者教學課程中使用的 鮑魚資料集 來探索迴歸樹狀結構的結構。如同我們在上方對分類所做的一樣,我們先載入並準備用於訓練的資料。給定 8 個變數,我們想要預測鮑魚殼中的環數。
載入、清理和準備資料
使用下列程式碼片段,我們可以看見除了 Type (性別) 變數之外,特徵都是數值。
# Download the dataset.
!wget -q https://storage.googleapis.com/download.tensorflow.org/data/abalone_raw.csv -O /tmp/abalone.csv

df_abalone = pd.read_csv("/tmp/abalone.csv")
df_abalone.head(3)
幸運的是,沒有遺失資料需要處理
df_abalone.isna().any()
Type             False
LongestShell     False
Diameter         False
Height           False
WholeWeight      False
ShuckedWeight    False
VisceraWeight    False
ShellWeight      False
Rings            False
dtype: bool
分割訓練/測試集並訓練模型
abalone_label = "Rings"   # Name of the classification target label

# Split into training and test sets 70/30
df_train_abalone, df_test_abalone = split_dataset(df_abalone)
print(f"{len(df_train_abalone)} examples in training, {len(df_test_abalone)} examples for testing.")

# Convert to tensorflow data sets
train_ds = tfdf.keras.pd_dataframe_to_tf_dataset(df_train_abalone, label=abalone_label, task=tfdf.keras.Task.REGRESSION)
test_ds = tfdf.keras.pd_dataframe_to_tf_dataset(df_test_abalone, label=abalone_label, task=tfdf.keras.Task.REGRESSION)
2935 examples in training, 1242 examples for testing.
訓練隨機森林迴歸器
現在我們有了訓練集和測試集,讓我們訓練一個隨機森林迴歸器。由於資料的性質,我們需要人為地限制樹狀結構的高度才能視覺化。(限制樹狀結構深度也是一種正規化形式,以防止過度配適。) 最大深度 5 已足夠深入,足以相當準確,但又夠小以進行視覺化。
rmodel = tfdf.keras.RandomForestModel(task=tfdf.keras.Task.REGRESSION,
                                      max_depth=5,      # don't let the tree get too big
                                      random_seed=1234, # create same tree every time
                                      verbose=0)
rmodel.fit(x=train_ds)
[INFO 24-04-20 11:36:22.3119 UTC kernel.cc:1233] Loading model from path /tmpfs/tmp/tmpa_ykq0gz/model/ with prefix ba97bae0bd574ab0
[INFO 24-04-20 11:36:22.3376 UTC decision_forest.cc:734] Model loaded with 300 root(s), 9264 node(s), and 8 input feature(s).
[INFO 24-04-20 11:36:22.3376 UTC abstract_model.cc:1344] Engine "RandomForestOptPred" built
[INFO 24-04-20 11:36:22.3376 UTC kernel.cc:1061] Use fast generic engine
<tf_keras.src.callbacks.History at 0x7fca78ee7ee0>
讓我們使用 MAE 和 MSE 檢查模型的準確度。Rings 的範圍是 1-27,因此測試集上的 MAE 為 1.66 並不算太好,但對於我們的示範目的來說還可以。
# Evaluate the model on the test dataset.
rmodel.compile(metrics=["mae","mse"])
evaluation = rmodel.evaluate(test_ds, return_dict=True, verbose=0)

print(f"MSE: {evaluation['mse']}")
print(f"MAE: {evaluation['mae']}")
print(f"RMSE: {math.sqrt(evaluation['mse'])}")
MSE: 5.4397759437561035
MAE: 1.6559592485427856
RMSE: 2.3323327257825164
顯示決策樹
若要使用 dtreeviz,我們需要將模型和訓練資料捆綁在一起。我們也必須從隨機森林中選擇特定的樹狀結構來顯示;讓我們選擇樹狀結構 3,如同我們對分類所做的一樣。
abalone_features = [f.name for f in rmodel.make_inspector().features()]
viz_rmodel = dtreeviz.model(rmodel, tree_index=3,
                           X_train=df_train_abalone[abalone_features],
                           y_train=df_train_abalone[abalone_label],
                           feature_names=abalone_features,
                           target_name='Rings')
函數 view() 會顯示樹狀結構,但現在決策節點是散佈圖,而不是堆疊長條圖。每個決策節點都會顯示指示變數與目標 (Rings) 的邊際圖
viz_rmodel.view(scale=1.2)

如同分類一樣,迴歸從樹狀結構的根節點朝向特定的葉節點進行,最終對特定的測試執行個體進行預測。通往葉節點的路徑上的節點會測試數值或類別變數,將迴歸器引導到特徵空間的特定區域,該區域 (希望) 具有非常相似的目標值。
葉節點是帶狀圖,顯示葉節點中所有執行個體的目標變數 Rings 值。水平參數沒有意義,只是一些雜訊,用於分隔點,以便我們看見密度所在位置。請考量左下角的葉節點,n=10,Rings=3.30。這表示該葉節點中 10 個執行個體的平均 Rings 值為 3.30,這也是決策樹對到達該葉節點的任何測試執行個體的預測。
讓我們放大樹狀結構的根節點,以查看迴歸器如何分割變數 ShellWeight
viz_rmodel.view(depth_range_to_display=[0,0], scale=2)

對於 ShellWeight<0.164 的測試執行個體,迴歸器會下降到根節點的左子節點;否則,它會下降到右子節點。水平虛線表示與 ShellWeight 高於或低於 0.164 的執行個體相關聯的平均 Rings 值。
另一方面,類別變數的決策節點會測試類別的子集,因為類別是無序的。在樹狀結構的第四層中,有兩個決策節點測試類別變數 Type
viz_rmodel.view(depth_range_to_display=[3,3], scale=1.5)

測試類別的迴歸器節點使用顏色來表示子集。例如,第四層左側的決策節點指示迴歸器在測試執行個體具有 Type=I 或 Type=F 時下降到左側;否則,迴歸器會下降到右側。黃色和藍色表示與左右分支相關聯的兩個類別值子集。水平虛線表示具有相關類別值的執行個體的平均 Rings 目標值。
若要顯示大型樹狀結構,您可以使用方向參數來取得樹狀結構的從左到右版本,雖然它相當高,因此使用比例縮小它是個好主意。使用您機器上的螢幕放大功能,您可以放大感興趣的區域。
viz_rmodel.view(orientation='LR', scale=.5)

我們可以透過非精美圖表節省空間。它仍然顯示決策節點分割變數和分割點;只是沒有那麼漂亮。
viz_rmodel.view(fancy=False, scale=.75)

檢查葉節點統計資料
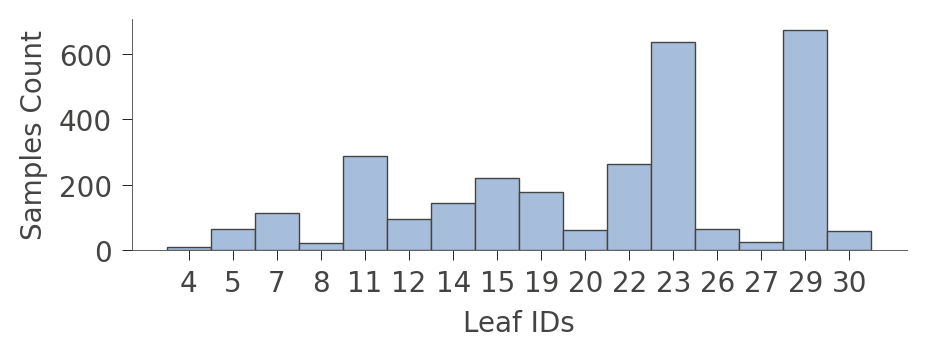
當圖形變得非常大時,有時最好專注於葉節點。函數 leaf_sizes() 指示在每個葉節點中找到的執行個體數量
viz_rmodel.leaf_sizes(figsize=(5,1.5))
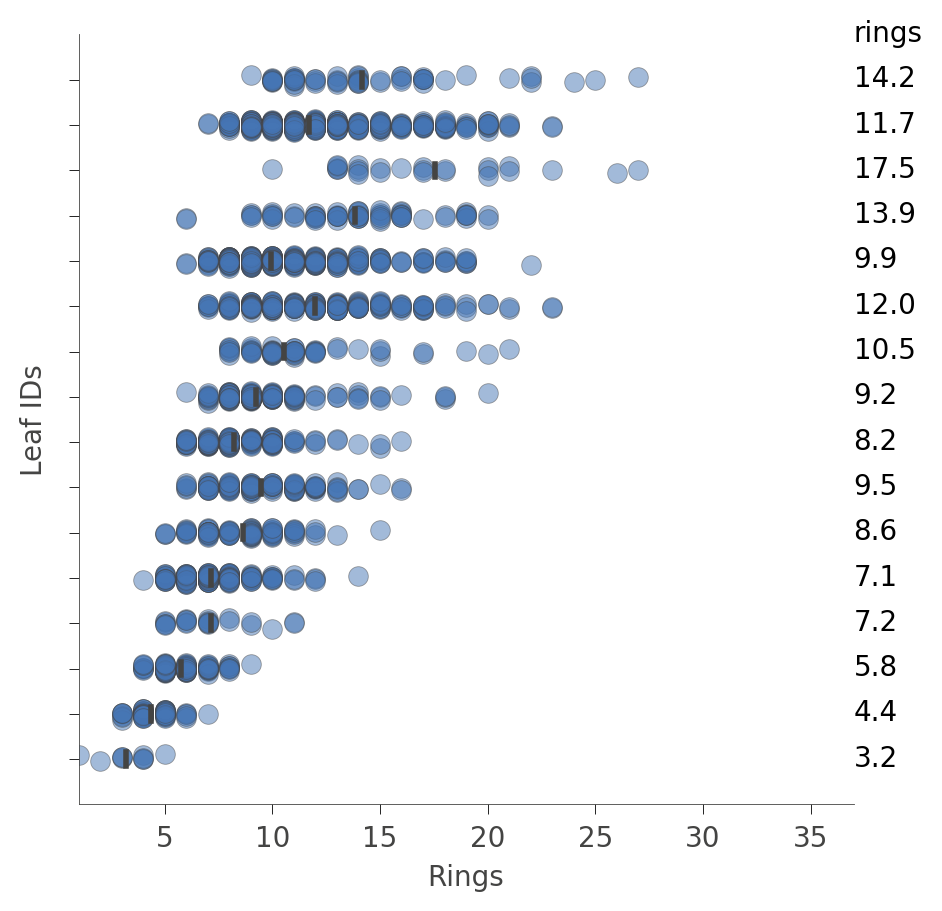
我們也可以查看葉節點中執行個體的分布 (Rings 值)。垂直軸的每個葉節點都有一個「列」,而水平軸顯示每個葉節點中執行個體的 Rings 值分布。右側的欄顯示每個葉節點的平均目標值。
viz_rmodel.rtree_leaf_distributions(figsize=(5,5))
或者,我們可以取得特定節點中執行個體特徵的相關資訊。例如,以下說明如何取得葉節點 ID 29 中特徵的相關資訊 (執行個體最多的葉節點)
viz_rmodel.node_stats(node_id=29)
決策樹如何預測執行個體的值
若要預測特定執行個體的值,決策樹會根據測試執行個體中的特徵值,從根節點向下蜿蜒到特定的葉節點。個別樹狀結構的預測只是位於該葉節點中的執行個體 (來自訓練集) 的 Rings 值的平均值。如果我們透過參數 x 提供測試執行個體,dtreeviz 程式庫可以圖解說明此程序。
x = df_abalone[abalone_features].iloc[1234]
viz_rmodel.view(x=x, scale=.75)
/tmpfs/src/tf_docs_env/lib/python3.9/site-packages/dtreeviz/models/shadow_decision_tree.py:335: FutureWarning: Series.__getitem__ treating keys as positions is deprecated. In a future version, integer keys will always be treated as labels (consistent with DataFrame behavior). To access a value by position, use `ser.iloc[pos]`
/tmpfs/src/tf_docs_env/lib/python3.9/site-packages/dtreeviz/trees.py:1351: FutureWarning: Series.__getitem__ treating keys as positions is deprecated. In a future version, integer keys will always be treated as labels (consistent with DataFrame behavior). To access a value by position, use `ser.iloc[pos]`
/tmpfs/src/tf_docs_env/lib/python3.9/site-packages/dtreeviz/trees.py:1356: FutureWarning: Series.__getitem__ treating keys as positions is deprecated. In a future version, integer keys will always be treated as labels (consistent with DataFrame behavior). To access a value by position, use `ser.iloc[pos]`
/tmpfs/src/tf_docs_env/lib/python3.9/site-packages/dtreeviz/trees.py:1324: FutureWarning: Series.__getitem__ treating keys as positions is deprecated. In a future version, integer keys will always be treated as labels (consistent with DataFrame behavior). To access a value by position, use `ser.iloc[pos]`

如果該視覺化效果太大,我們可以將圖表縮小到僅限於從根節點到實際遍歷的葉節點的路徑
viz_rmodel.view(x=x, show_just_path=True, scale=1.0)
/tmpfs/src/tf_docs_env/lib/python3.9/site-packages/dtreeviz/models/shadow_decision_tree.py:335: FutureWarning: Series.__getitem__ treating keys as positions is deprecated. In a future version, integer keys will always be treated as labels (consistent with DataFrame behavior). To access a value by position, use `ser.iloc[pos]`
/tmpfs/src/tf_docs_env/lib/python3.9/site-packages/dtreeviz/trees.py:1351: FutureWarning: Series.__getitem__ treating keys as positions is deprecated. In a future version, integer keys will always be treated as labels (consistent with DataFrame behavior). To access a value by position, use `ser.iloc[pos]`
/tmpfs/src/tf_docs_env/lib/python3.9/site-packages/dtreeviz/trees.py:1356: FutureWarning: Series.__getitem__ treating keys as positions is deprecated. In a future version, integer keys will always be treated as labels (consistent with DataFrame behavior). To access a value by position, use `ser.iloc[pos]`
/tmpfs/src/tf_docs_env/lib/python3.9/site-packages/dtreeviz/trees.py:1324: FutureWarning: Series.__getitem__ treating keys as positions is deprecated. In a future version, integer keys will always be treated as labels (consistent with DataFrame behavior). To access a value by position, use `ser.iloc[pos]`

我們可以透過使用水平方向使其更小
viz_rmodel.view(x=x, show_just_path=True, scale=.75, orientation="LR")
/tmpfs/src/tf_docs_env/lib/python3.9/site-packages/dtreeviz/models/shadow_decision_tree.py:335: FutureWarning: Series.__getitem__ treating keys as positions is deprecated. In a future version, integer keys will always be treated as labels (consistent with DataFrame behavior). To access a value by position, use `ser.iloc[pos]`
/tmpfs/src/tf_docs_env/lib/python3.9/site-packages/dtreeviz/trees.py:1351: FutureWarning: Series.__getitem__ treating keys as positions is deprecated. In a future version, integer keys will always be treated as labels (consistent with DataFrame behavior). To access a value by position, use `ser.iloc[pos]`
/tmpfs/src/tf_docs_env/lib/python3.9/site-packages/dtreeviz/trees.py:1356: FutureWarning: Series.__getitem__ treating keys as positions is deprecated. In a future version, integer keys will always be treated as labels (consistent with DataFrame behavior). To access a value by position, use `ser.iloc[pos]`
/tmpfs/src/tf_docs_env/lib/python3.9/site-packages/dtreeviz/trees.py:1324: FutureWarning: Series.__getitem__ treating keys as positions is deprecated. In a future version, integer keys will always be treated as labels (consistent with DataFrame behavior). To access a value by position, use `ser.iloc[pos]`

有時,只需取得模型如何測試我們的特徵值以做出決策的英文描述會更容易
print(viz_rmodel.explain_prediction_path(x=x))
0.25 <= Diameter
ShellWeight < 0.11
Type not in {'M', 'F'}
/tmpfs/src/tf_docs_env/lib/python3.9/site-packages/dtreeviz/models/shadow_decision_tree.py:335: FutureWarning: Series.__getitem__ treating keys as positions is deprecated. In a future version, integer keys will always be treated as labels (consistent with DataFrame behavior). To access a value by position, use `ser.iloc[pos]`
/tmpfs/src/tf_docs_env/lib/python3.9/site-packages/dtreeviz/interpretation.py:54: FutureWarning: Series.__getitem__ treating keys as positions is deprecated. In a future version, integer keys will always be treated as labels (consistent with DataFrame behavior). To access a value by position, use `ser.iloc[pos]`
特徵空間分割
使用 rtree_feature_space(),我們可以看見決策樹如何透過一系列分割來分割特徵空間。例如,以下說明決策樹如何分割特徵 ShellWeight
viz_rmodel.rtree_feature_space(features=['ShellWeight'],
                              show={'splits'})
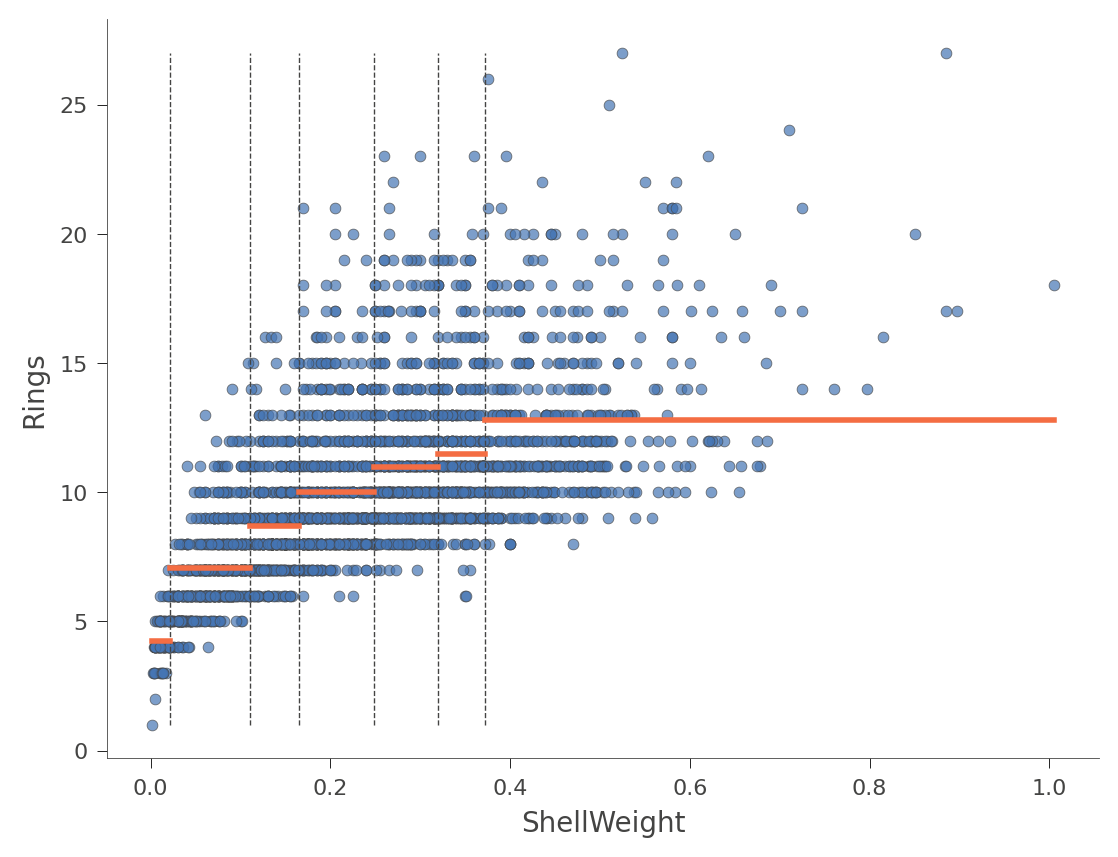
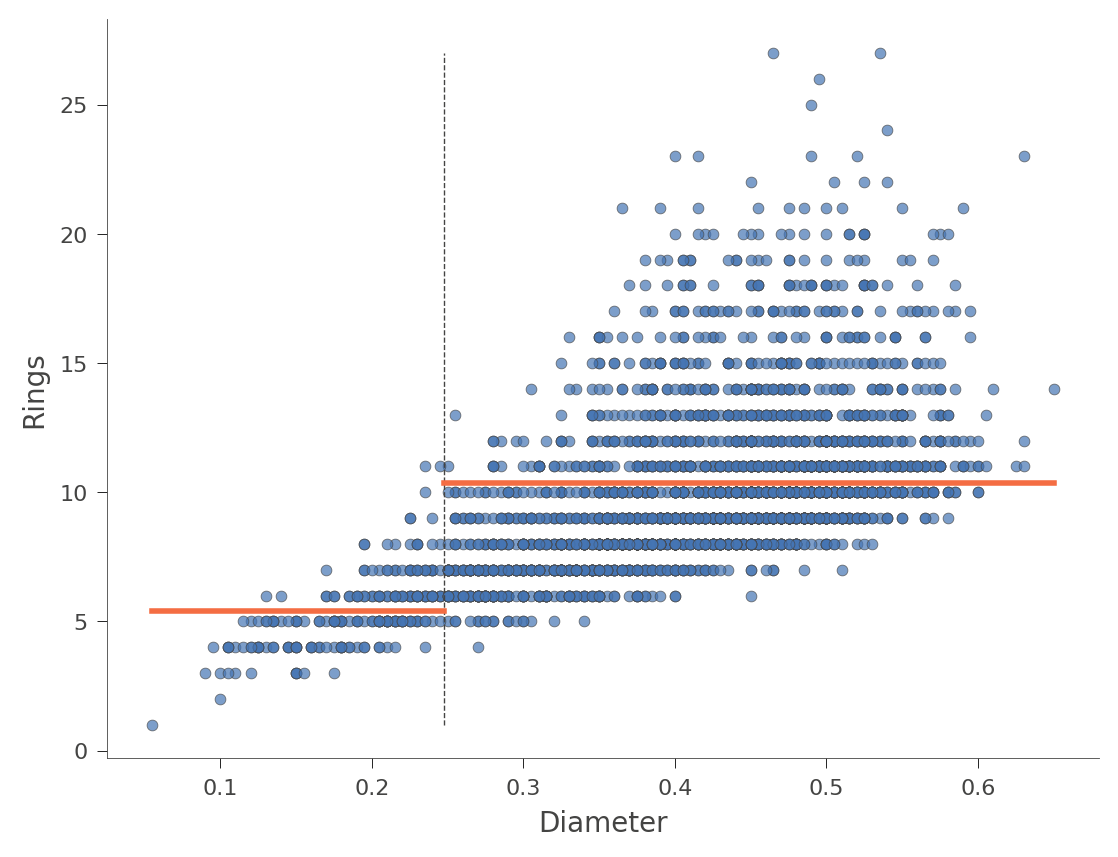
水平橙色長條表示每個區域內的平均 Rings 值。以下是另一個使用特徵 Diameter (樹狀結構中只有一個分割) 的範例
viz_rmodel.rtree_feature_space(features=['Diameter'], show={'splits'})
我們也可以查看二維特徵空間,其中 Rings 值以顏色從綠色 (低) 到藍色 (高) 變化
viz_rmodel.rtree_feature_space(features=['ShellWeight','LongestShell'], show={'splits'})
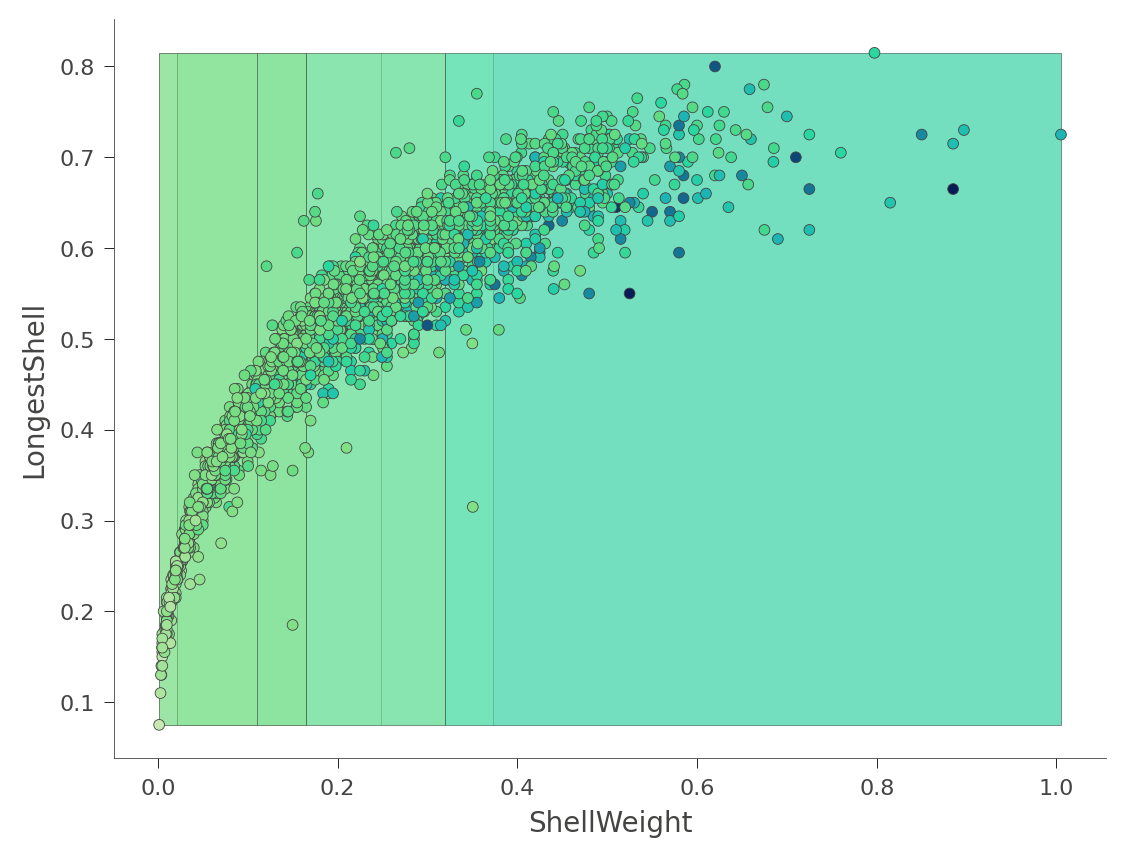
熱圖可能會令人困惑,因為它實際上是 3D 空間的 2D 投影:兩個特徵 x 目標值。dtreeviz 可以改為向您顯示此三維圖 (從各種角度和高度)
viz_rmodel.rtree_feature_space3D(features=['ShellWeight','LongestShell'],
                              show={'splits'}, elev=30, azim=140, dist=11, figsize=(9,8))
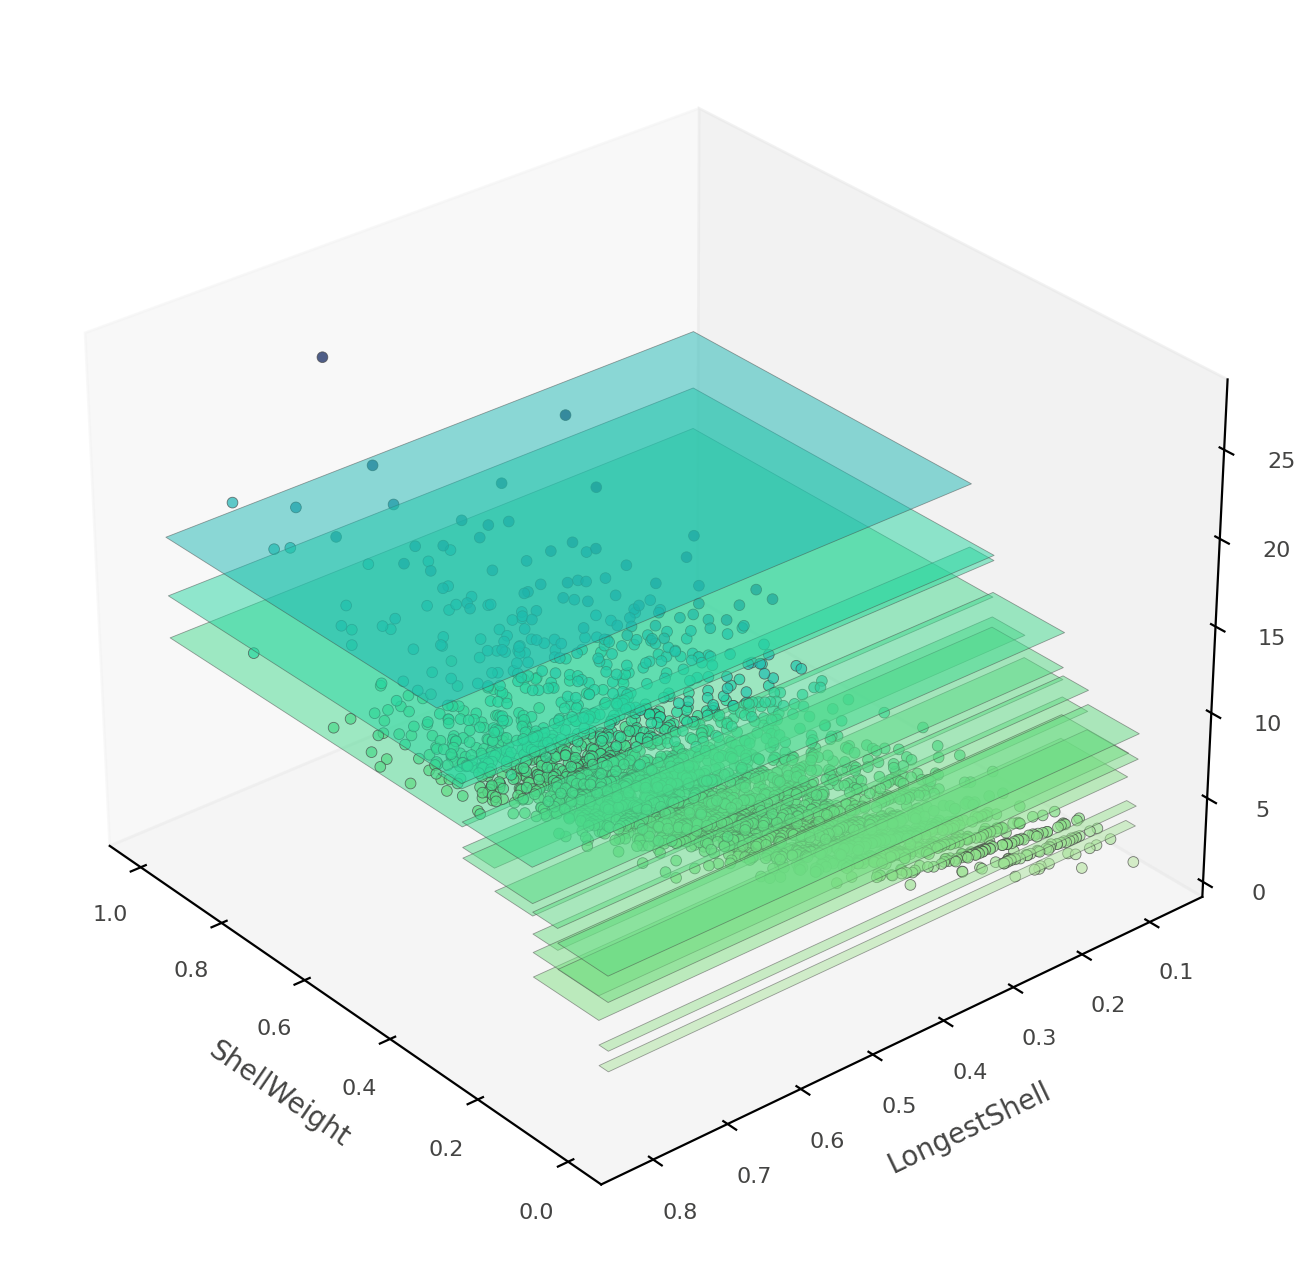
如果 ShellWeight 和 LongestShell 是模型測試的唯一特徵,則不會有重疊的垂直「板」。特徵空間的每個 2D 區域都會做出獨特的預測。在此樹狀結構中,還有其他特徵可以區分不明確的垂直預測區域。
此時,您已學會如何使用 dtreeviz 來顯示決策樹的結構、繪製葉節點資訊、追蹤模型如何解譯特定執行個體,以及模型如何分割未來空間。您已準備好使用您自己的資料集來視覺化和解譯樹狀結構!